2025-11-03 10:37 UTC
Lead Overview
Within the European trading session, XAGUSD has demonstrated notable bullish momentum. The alignment of strong bullish signals on the H1 and M15 charts suggests a robust short-term upside. With a potential ISM Manufacturing Prices catalyst on the horizon, traders are analyzing key technical levels to assess the durability of this upward move. Current forward probabilities favor a neutral stance, with bullish scenarios contingent on a break above resistance.
Macro Drivers
The broader market’s risk-on sentiment is influencing silver’s current trajectory. Despite a weak overall bullish outlook across longer timeframes, short-term charts are buoyed by positive investor sentiment. Market participants are poised to react to the upcoming ISM Manufacturing Prices data, which could further validate or challenge the ongoing bullish trend.
Key Technical Anchors
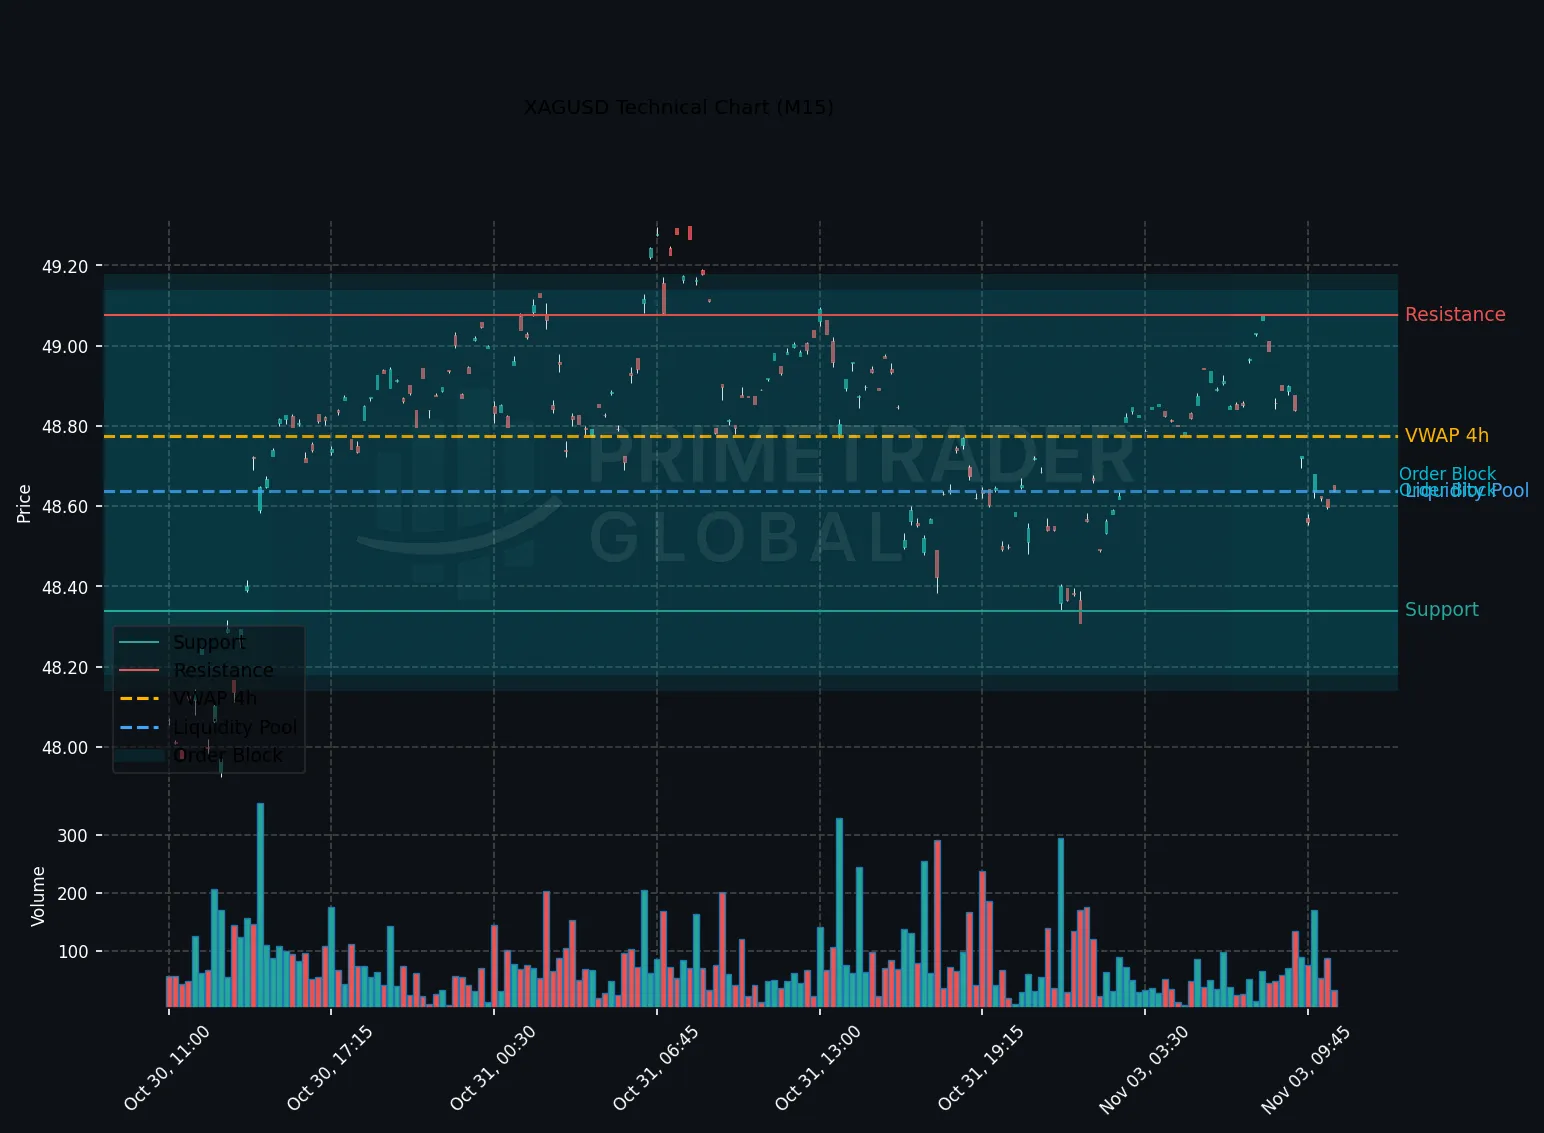
Resistance is identified at 49.299, with support at 47.925. A breach above the resistance level may confirm an extension of gains, prompting traders to recalibrate their positions accordingly. The market remains within a narrow trading range, offering tactical entry and exit points for institutions focusing on short-term movements.
Cross-Asset Signals
Silver’s price action is increasingly sensitive to macroeconomic developments, reflective of broader risk trends observed in commodities. No significant cross-asset signals are presently distorting silver’s risk profile, allowing traders to focus on intrinsic technical and fundamental factors.
Forward Outlook
With 67% probability, XAGUSD is likely to remain within the 47.925–49.299 range. However, a 16% chance exists for a bullish breakout, contingent on surpassing the 49.299 resistance, which could reinforce the short-term rally. The upcoming ISM Manufacturing Prices release remains a pivotal event that might alter this balance and potentially drive further momentum in silver trading.
Prime Trader Global | AI Market Intelligence | All insights derived from factual market data.