2025-11-03 10:37 UTC
Lead Overview
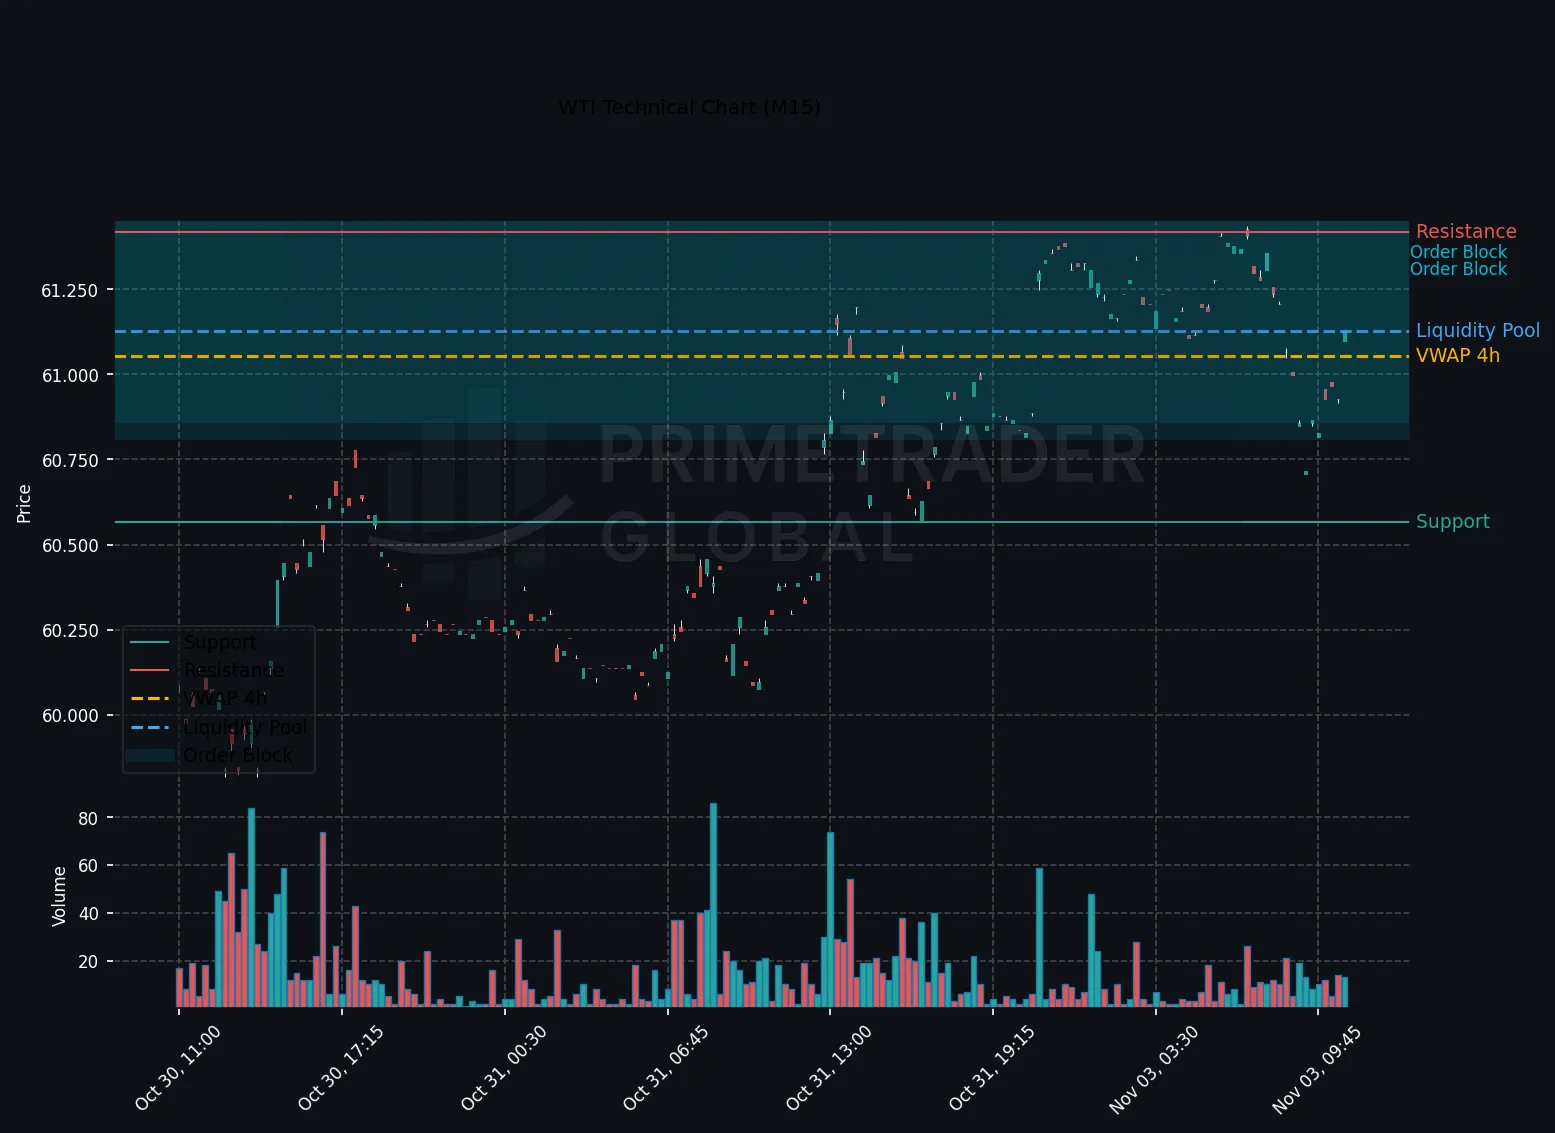
During the European session, WTI crude oil prices display a consolidation pattern on the H1 chart with a subtle upside inclination. This reflects a broader market risk-on sentiment but lacks sufficient catalyst to drive significant directional moves. Market participants should note that forward positioning probabilities suggest a neutral tone, supported by a 61% likelihood of range-bound trading between the key technical levels.
Macro Drivers
Current macroeconomic conditions show mixed signals, with no notable economic events or geopolitical developments exerting immediate pressure on WTI prices. The risk-on bias, primarily driven by broader financial market sentiment, has yet to translate into significant buying momentum within the commodity space.
Key Technical Anchors
WTI H1 timeframe is guided by well-defined technical boundaries, with support marked at 59.817 and resistance at 61.387. The prevailing consolidation frame reinforces the likelihood of a steady range-bound market absent new market-moving information.
Cross-Asset Signals
The lack of decisive movement in WTI is mirrored across correlated assets. In equities, modest gains suggest selective investor optimism, but fixed income markets show limited volatility, historically typical of periods lacking clear macro direction. Commodities peers remain largely unchanged, indicating a balanced cross-asset landscape.
Forward Outlook
Given the current market alignment, WTI is expected to remain within the noted price boundaries. While a break above 61.387 may trigger a bullish extension, the highest probability scenario remains a neutral range context between 59.817 and 61.387, as cross-asset dynamics do not yet favor a directional breakout. Thus, traders should contemplate maintaining neutral positions, poised to adjust as new data unfold.
Prime Trader Global | AI Market Intelligence | All insights derived from factual market data.