2025-11-10 20:41 UTC
Lead Overview
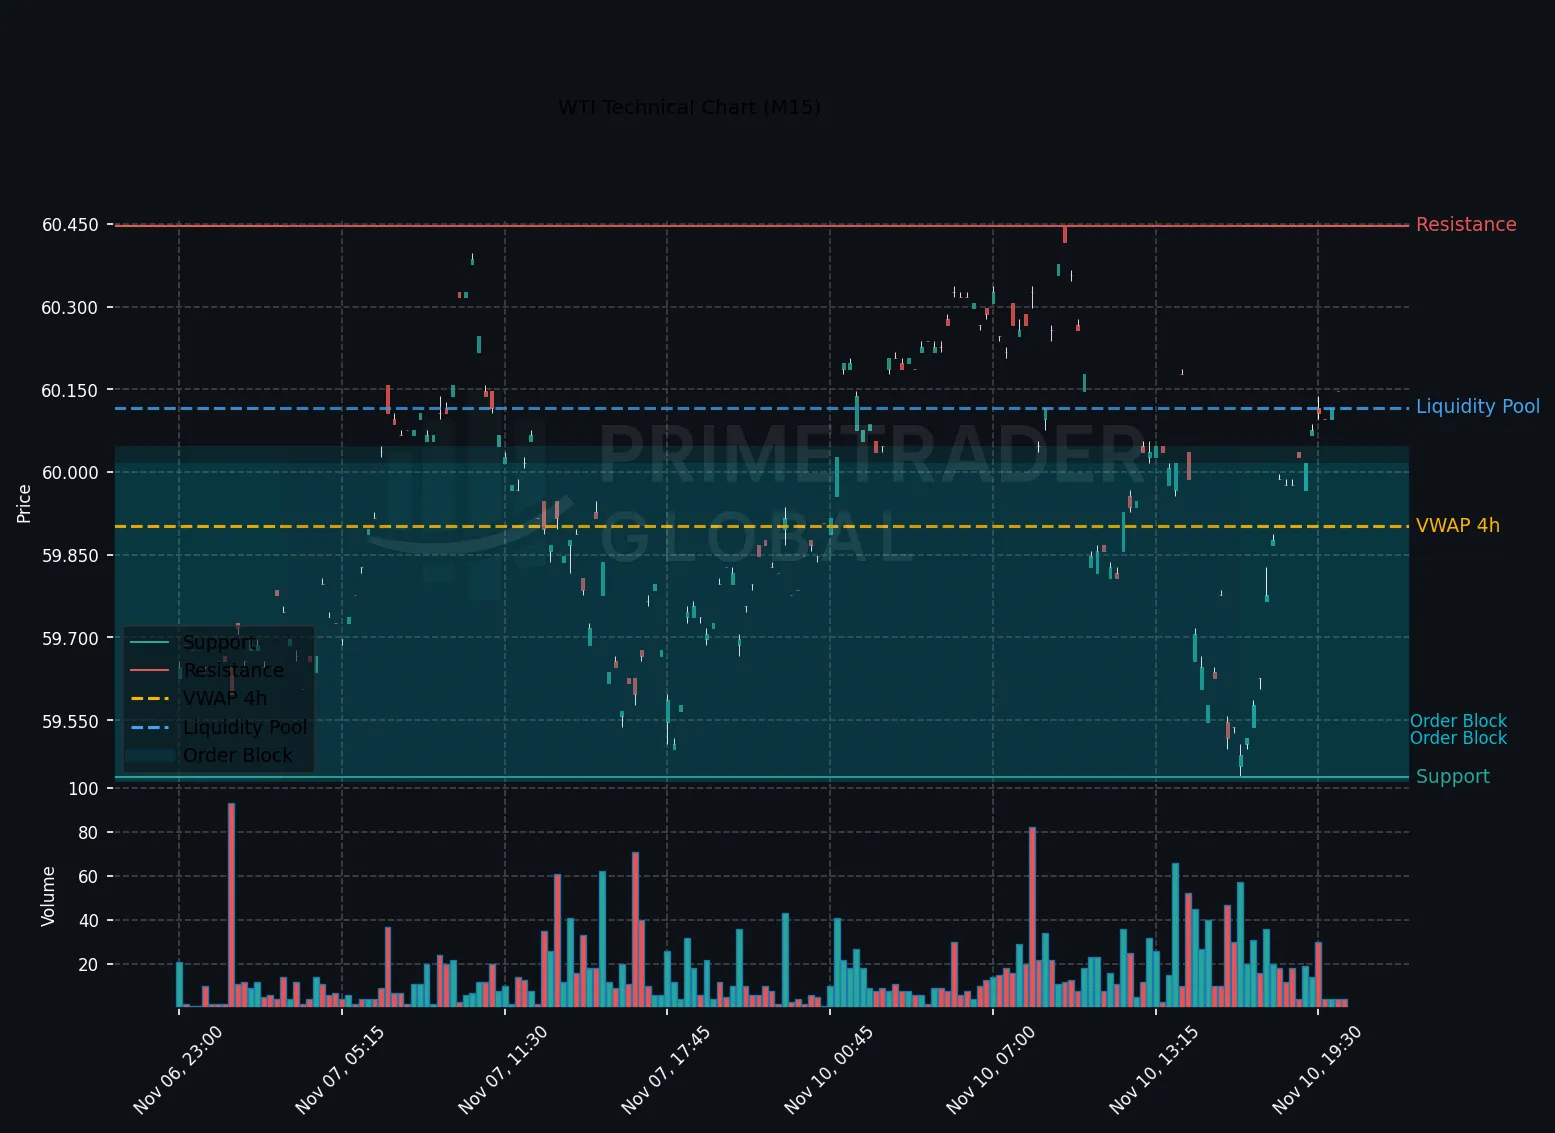
WTI crude oil, anchored within the US trading session, showcases an emerging risk-on sentiment. Current price action on the one-hour chart indicates potential range-bound trading, with key levels serving as pivotal anchors. The market’s stance remains predominantly neutral, capturing a 58% probability for a continuation of this range-bound behavior.
Macro Drivers
The WTI market is observed with an absence of significant macroeconomic drivers or breaking news, allowing technical dynamics to take precedence in shaping market behavior. The alignment of varying timeframes presents mixed signals, reinforcing the likelihood of sideways trading within established parameters.
Key Technical Anchors
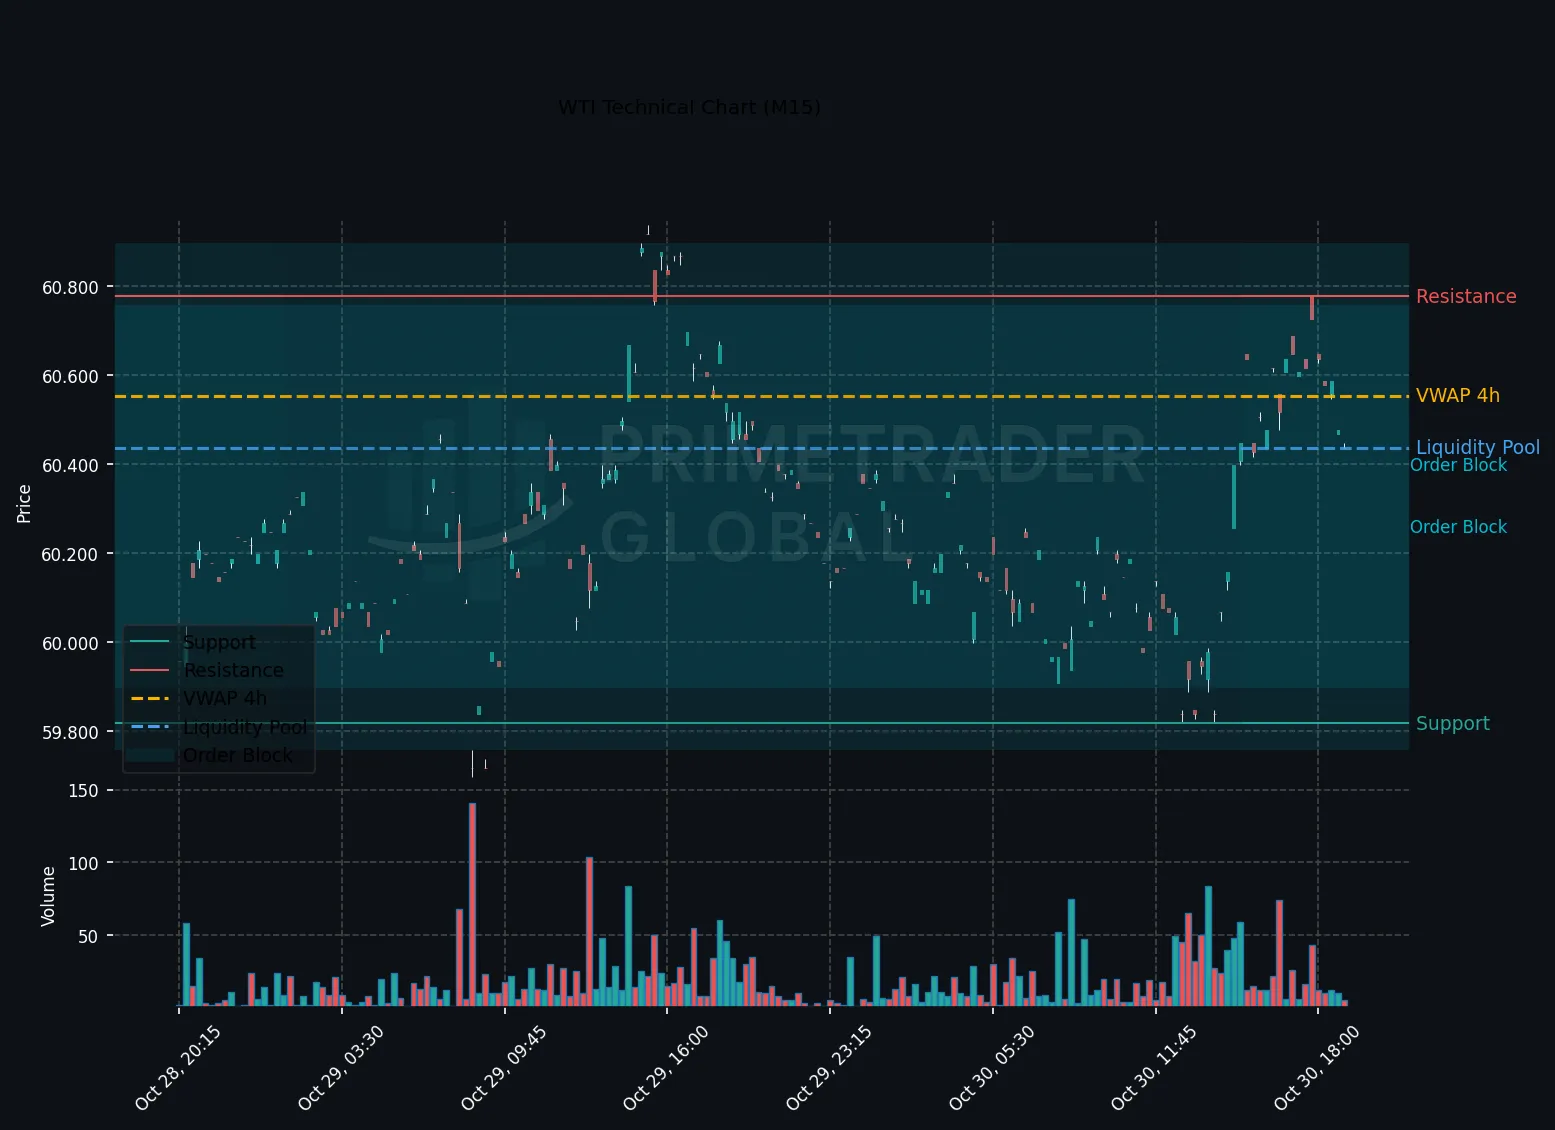
Key support and resistance levels stand out as pivotal guides for participants. Support is firmly established at 58.987, providing a base for any potential downside movements, while resistance is clearly defined at 60.337. These levels are critical in determining the directional bias and are closely monitored for potential breakouts or reversals.
Cross-Asset Signals
Cross-asset analysis does not indicate significant divergences that would suggest imminent shifts in WTI’s trend direction. Correlation measures with related commodities and indices remain stable, aligning with the currently neutral storyline and reinforcing the range-bound outlook.
Forward Outlook
The forward outlook for WTI is characterized by a predominant neutral stance, with a 58% probability of maintaining a trading range between 58.987 and 60.337. However, a break above 60.337 could stimulate a more bullish trajectory, opening the possibility for upside expansion. Conversely, should the price dip below 58.987, bearish momentum might extend losses, although this scenario holds a lower probability. Traders should remain vigilant for any technical breaches that might adjust positioning and risk strategies effectively.
Prime Trader Global | AI Market Intelligence | All insights derived from factual market data.