2025-10-09 16:42 UTC
Lead Overview
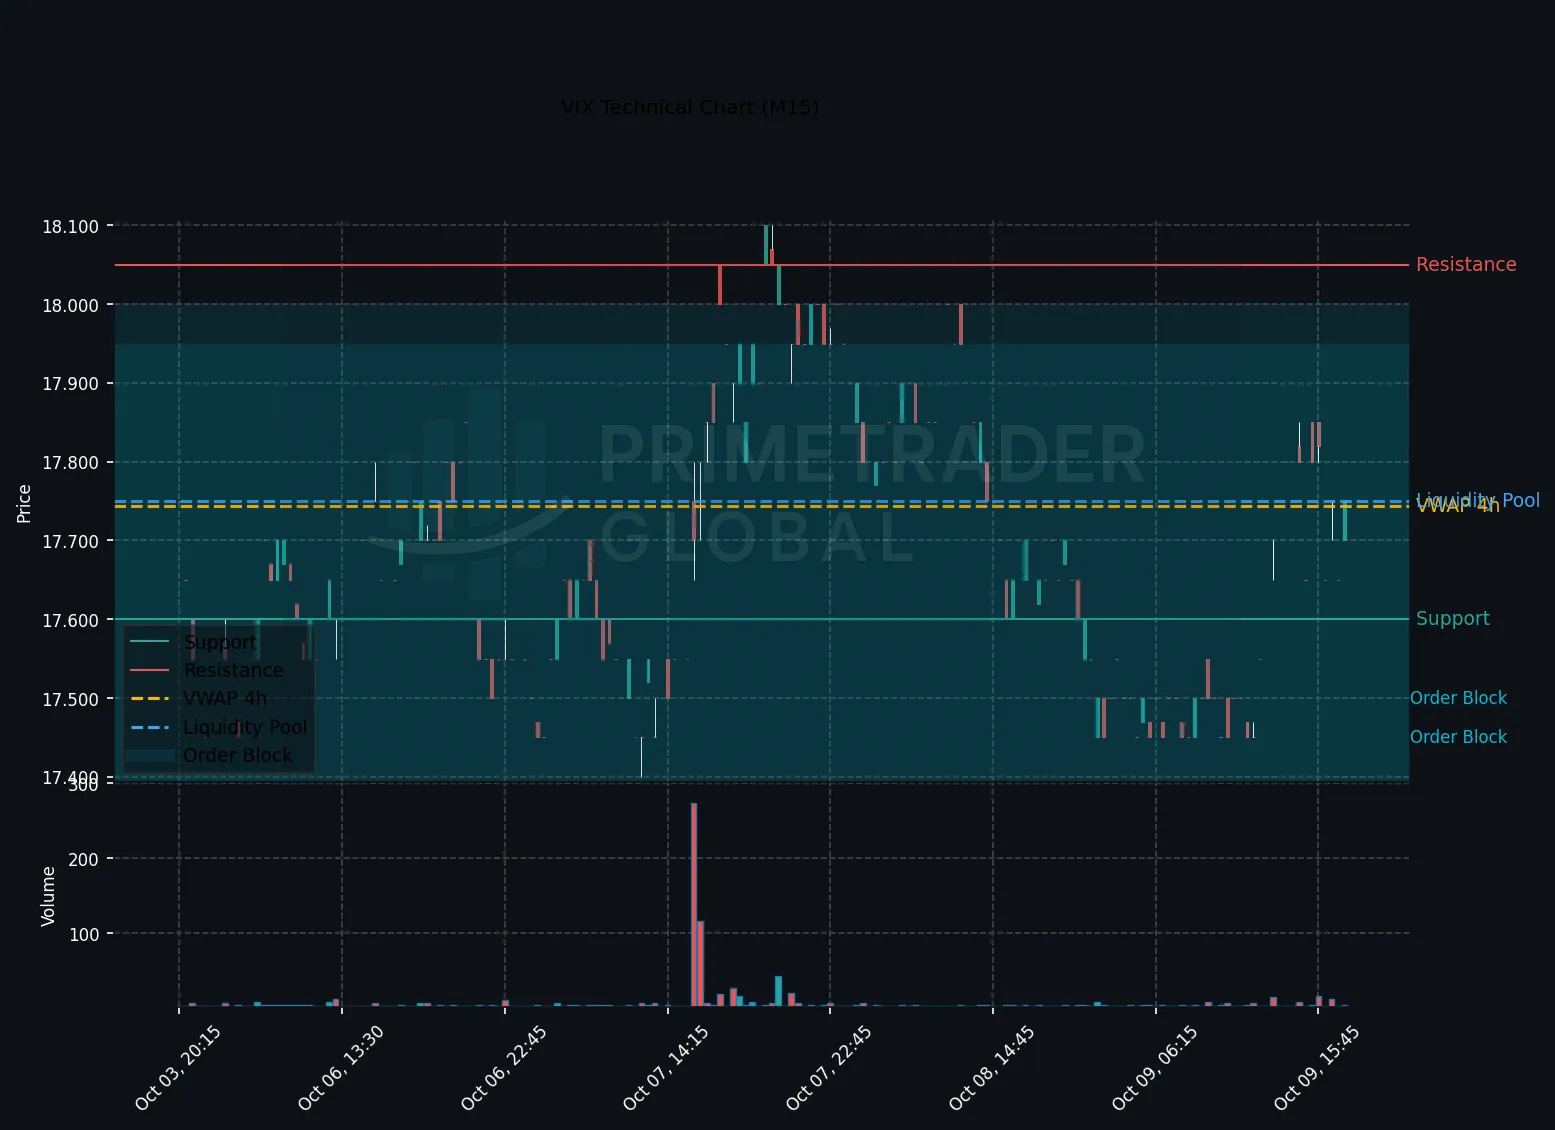
The US session saw a reduction in the CBOE Volatility Index (VIX) levels as a risk-on sentiment emerged. The strength in the travel sector, highlighted by Delta’s stock surge due to record-breaking revenue, has diminished immediate demand for volatility hedges. With no major events influencing the market, the prevailing outlook suggests a range-bound pattern, with a bullish probability of 15%, a neutral stance at 62%, and bearish potential pegged at 23%.
Macro Drivers
The travel sector’s impressive performance appears to have shifted the investor focus away from volatility hedges towards risk assets. This development has temporarily relaxed volatility metrics, such as the VIX, supporting a more benign risk outlook as no new economic surprises anchor immediate market moves.
Key Technical Anchors
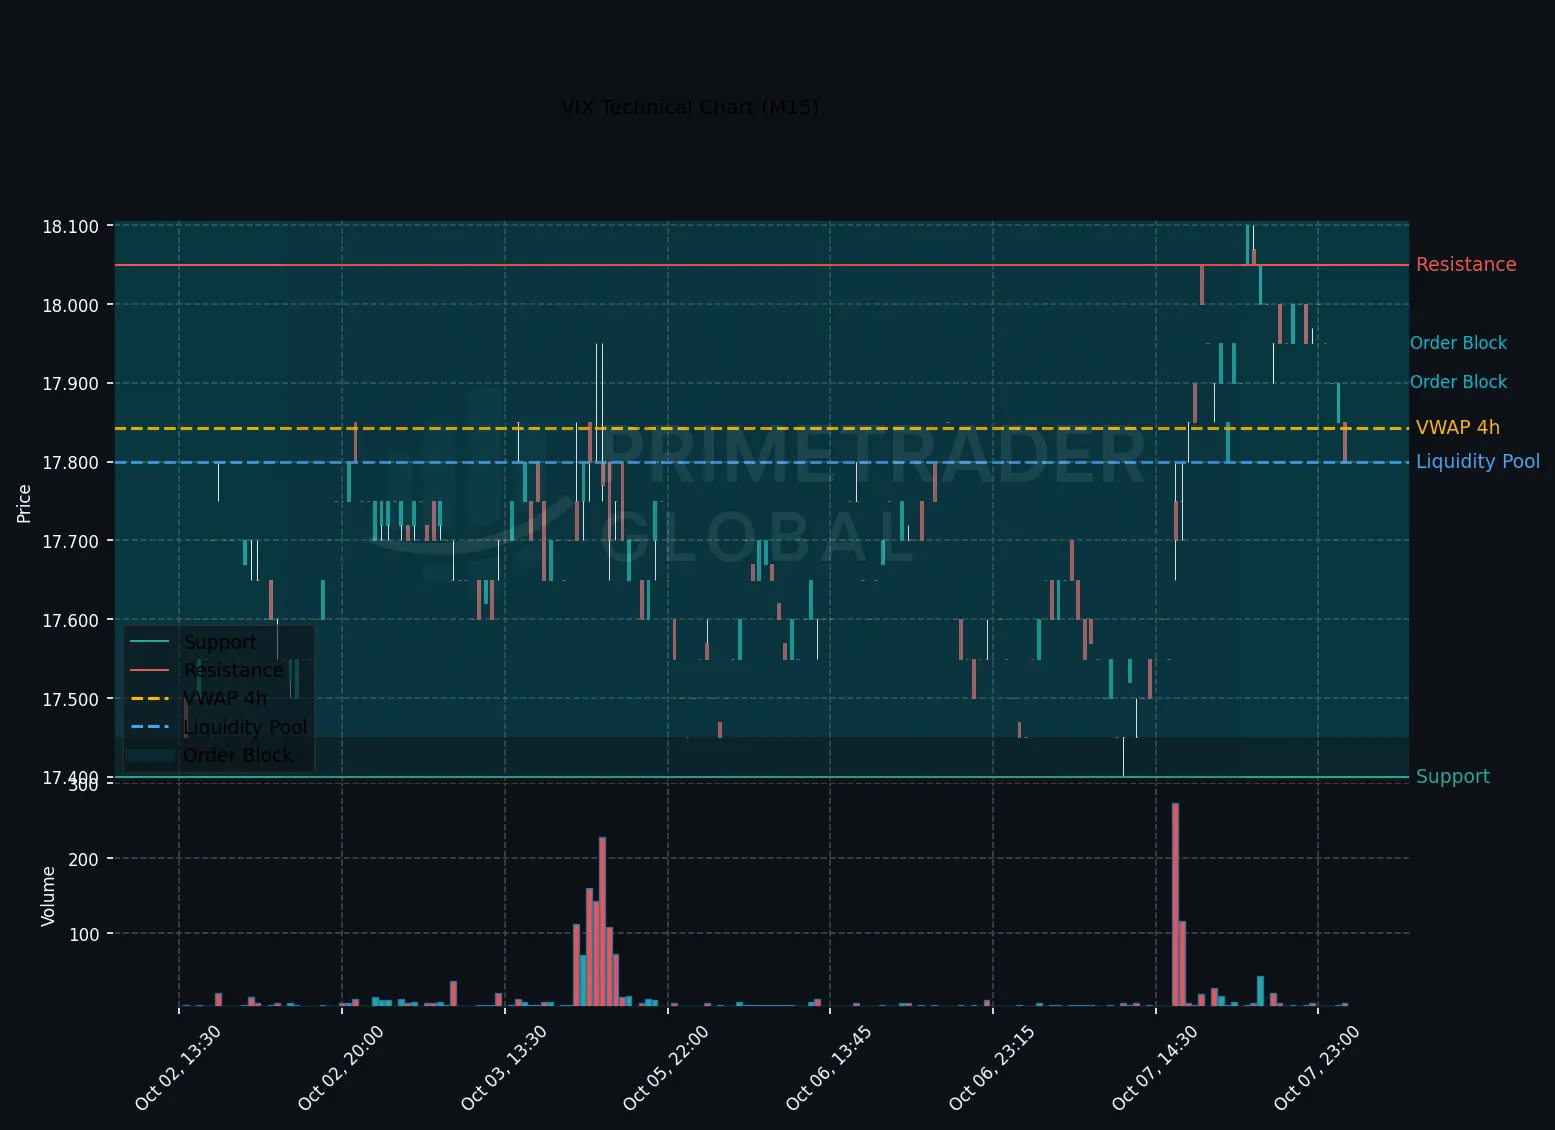
Technically, the VIX presents key support at 17.4 with resistance marked at 18.1. A break beyond these levels could alter current trends, but mixed multi-time frame analyses indicate a likely consolidation within this range for now.
Cross-Asset Signals
The easing of the VIX aligns with a broader risk-on mood, with equities exhibiting strength, particularly in cyclically sensitive sectors such as travel. Such cross-asset performance supports a reduction in hedging activity, indicative of market participants favoring equity exposure in place of volatility cover.
Forward Outlook
The prospective movement of the VIX will largely depend on a breach or hold of the 17.4–18.1 range. Current cross-asset trends and sector-specific performances, like those seen in travel stocks, suggest a neutral outlook. Should macro drivers shift or if technically significant levels are breached, this range could evolve, with a 15% bullish potential should VIX head higher than 18.1, otherwise maintaining a neutral stance.
Prime Trader Global | AI Market Intelligence | All insights derived from factual market data.