Lead Overview
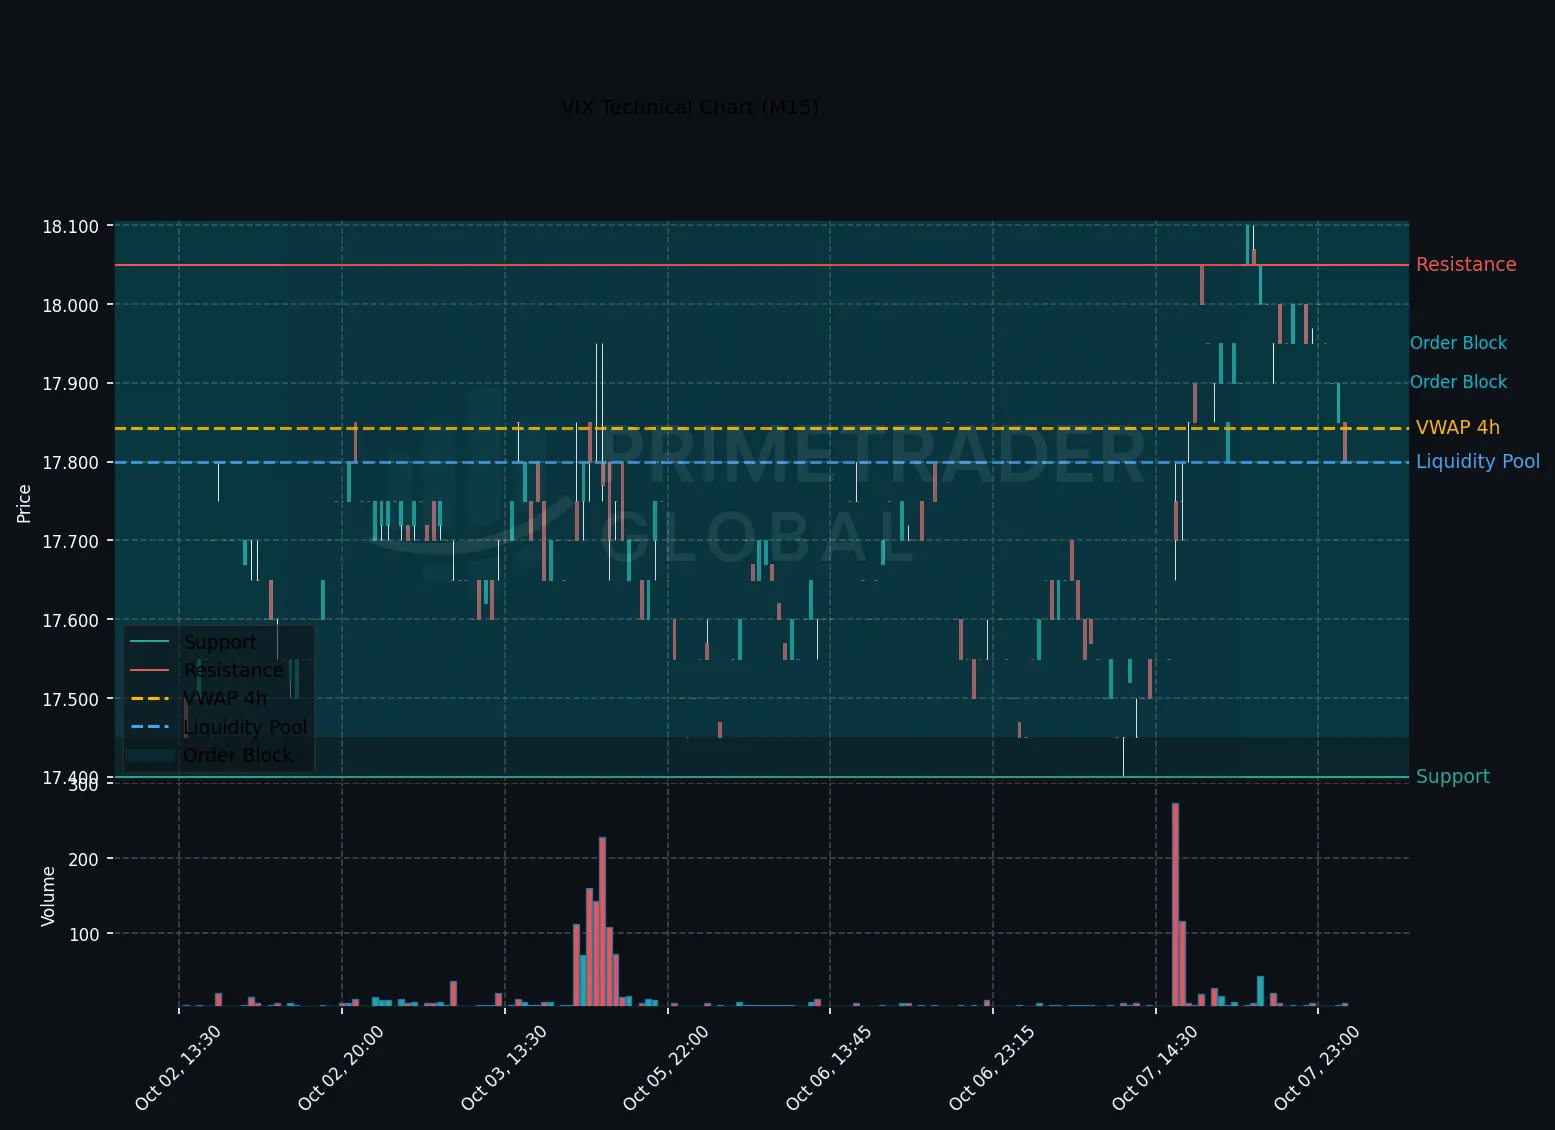
The volatility index (VIX) is currently demonstrating bullish momentum, with market participants focusing on a critical resistance level at 18.1. A breakthrough here could signal a continuation of upside movement.
Macro Drivers
Market sentiment continues to be shaped by macroeconomic factors, including inflation data and Federal Reserve policy signals. This environment influences demand for volatility hedging, potentially pushing the VIX higher.
Key Technical Anchors
Short-term charts including H1 and M15 show a strong bullish alignment, contrasting with broader bearish tendencies observed in longer-term perspectives. Key support stands at 17.4, while resistance is firmly placed at 18.1, marking the boundary between bullish and bearish scenarios.
Cross-Asset Signals
The relationship of the VIX with key equity indices and fixed income assets suggests a cautious optimism among traders. High correlations with equities may indicate that a break above 18.1 could be accompanied by equity sell-offs as risk aversion rises.
Forward Outlook
Looking ahead, the VIX outlook remains moderated. A bullish scenario (26%) could occur if the index breaks above 18.1, potentially leading to an upside continuation. A neutral outlook (60%) is probable, where the index could trade within the range of 17.4–18.1. A bearish case (14%) would see a drop below 17.4, extending recent losses and re-establishing a bearish sentiment.
Prime Trader Global | AI Market Intelligence | All insights derived from factual market data.