Lead Overview
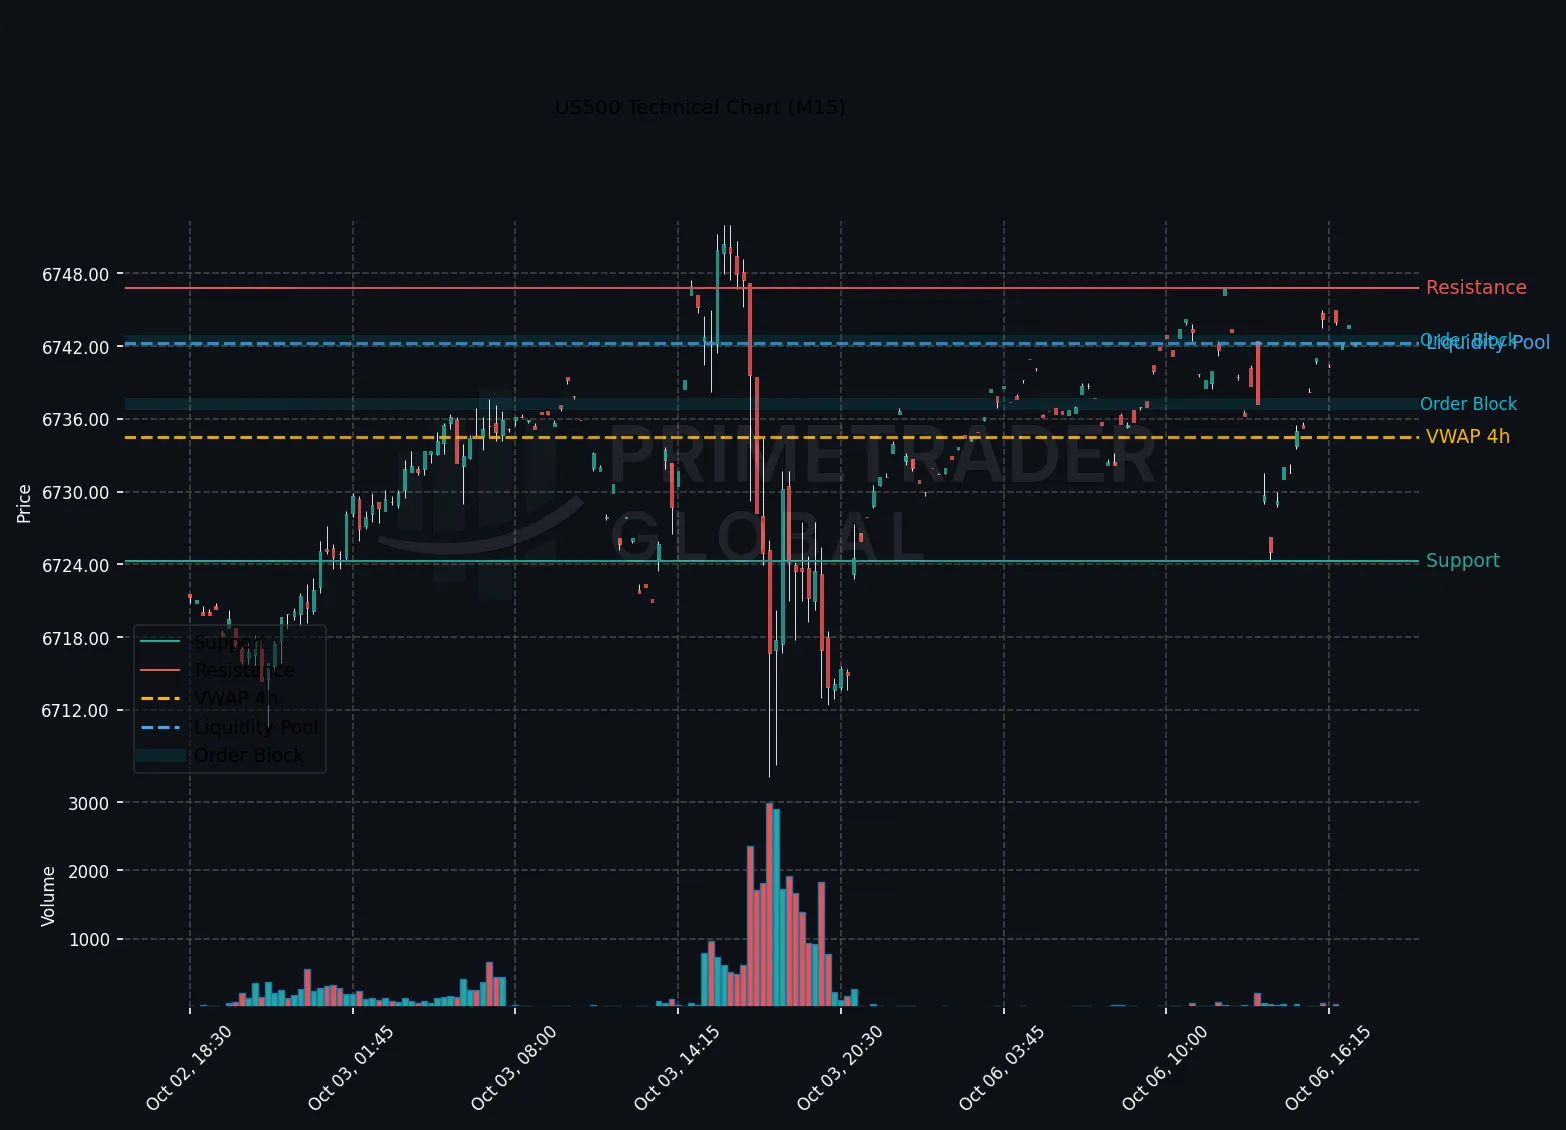
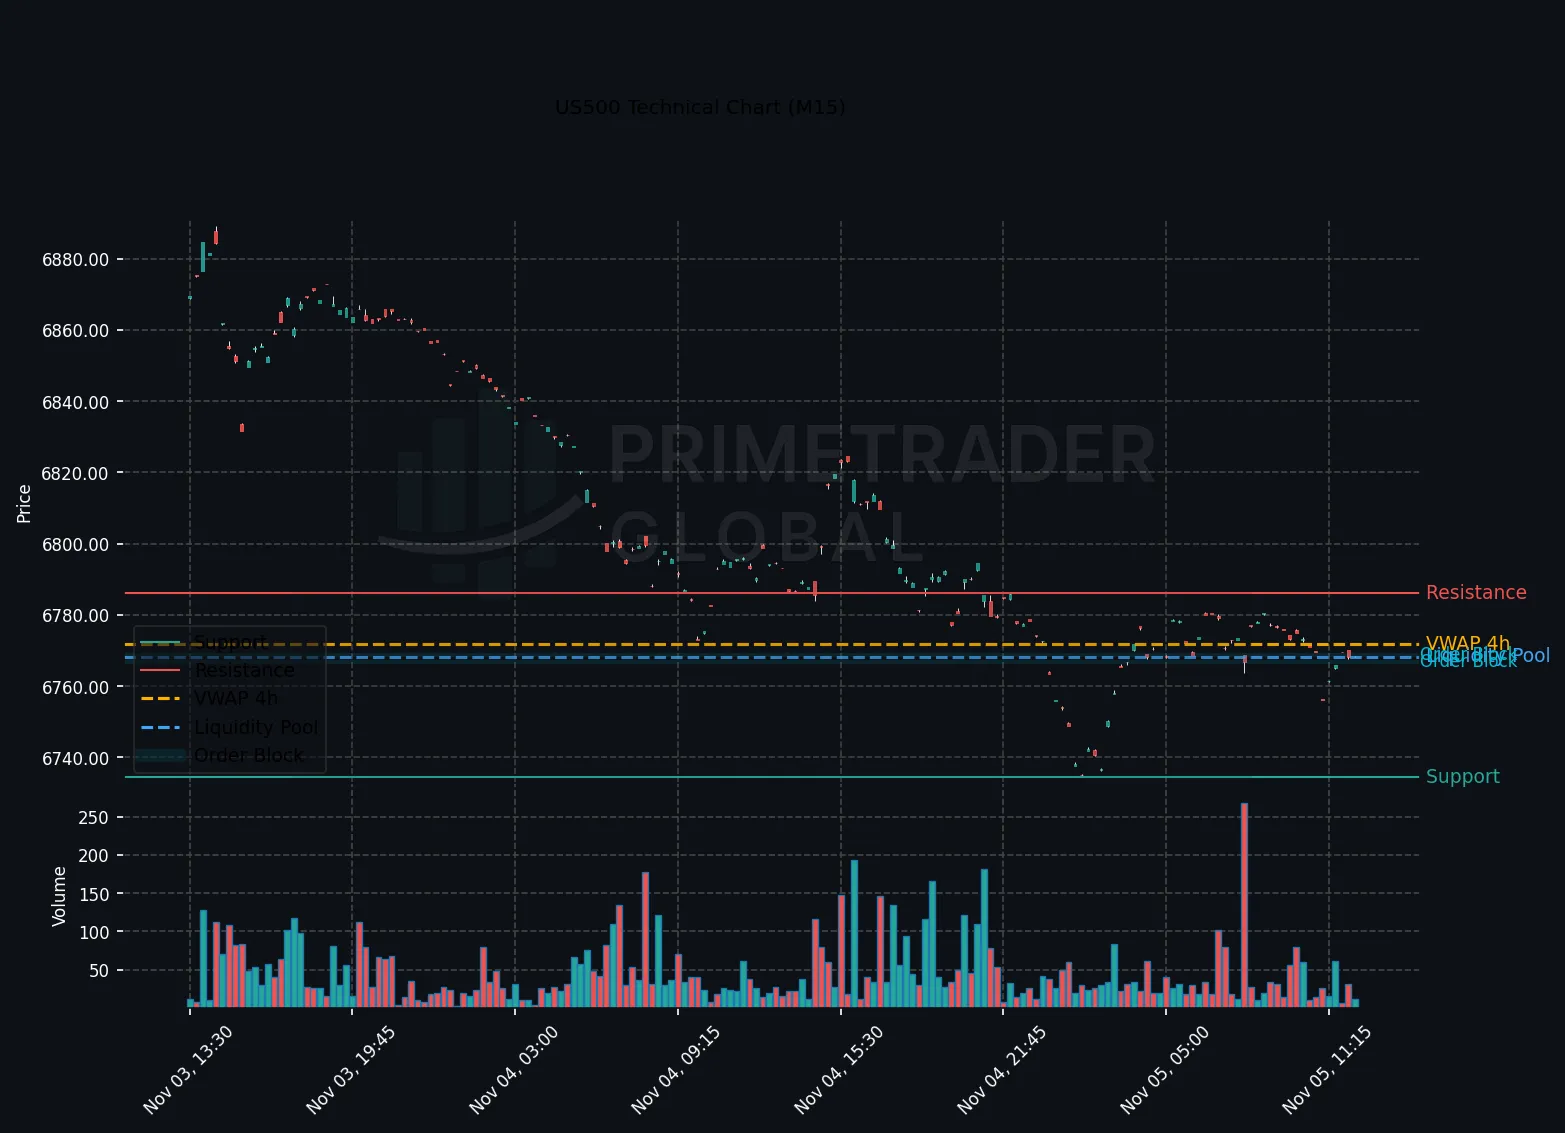
In the US session, the US500 index maintains a bullish tone on the hourly chart, operating within a construct that suggests upside potential despite risk-off sentiments and the lack of major market events. The H4 trend aligns with this bullish narrative, while the M15 timeframe hints at possible short-term corrections, creating a complex but predominantly bullish positioning landscape.
Macro Drivers
The US500’s resilience can be attributed to underlying strengths in market fundamentals, even as external factors contribute to a risk-off sentiment. Macroeconomic data releases and geopolitical developments will continue to play a crucial role in influencing market direction, yet the current structure suggests traders remain focused on momentum-driven strategies.
Key Technical Anchors
For traders, critical technical levels are established with support at 6706.47 and resistance at 6751.97. Breaking beyond this resistance could trigger a continuation of the bullish trend, while a decline beneath the support level may lead to an extension of potential losses.
Cross-Asset Signals
Investors should monitor cross-asset signals, particularly in equities versus fixed income. Movements in government bond yields may provide insights into risk sentiment and potential shifts in equity appetite, especially as the macroeconomic landscape evolves.
Forward Outlook
Looking ahead, the probabilities for the US500 remain as follows: Bullish (40%) — a break above 6751.97 could open further upside. Neutral (48%) — a range is likely to persist between 6706.47 and 6751.97. Bearish (11%) — should prices dip below 6706.47, extended losses may manifest. Thus, an informed approach to trading may involve closely watching these levels in context to the evolving market backdrop.
Prime Trader Global | AI Market Intelligence | All insights derived from factual market data.