Lead Overview
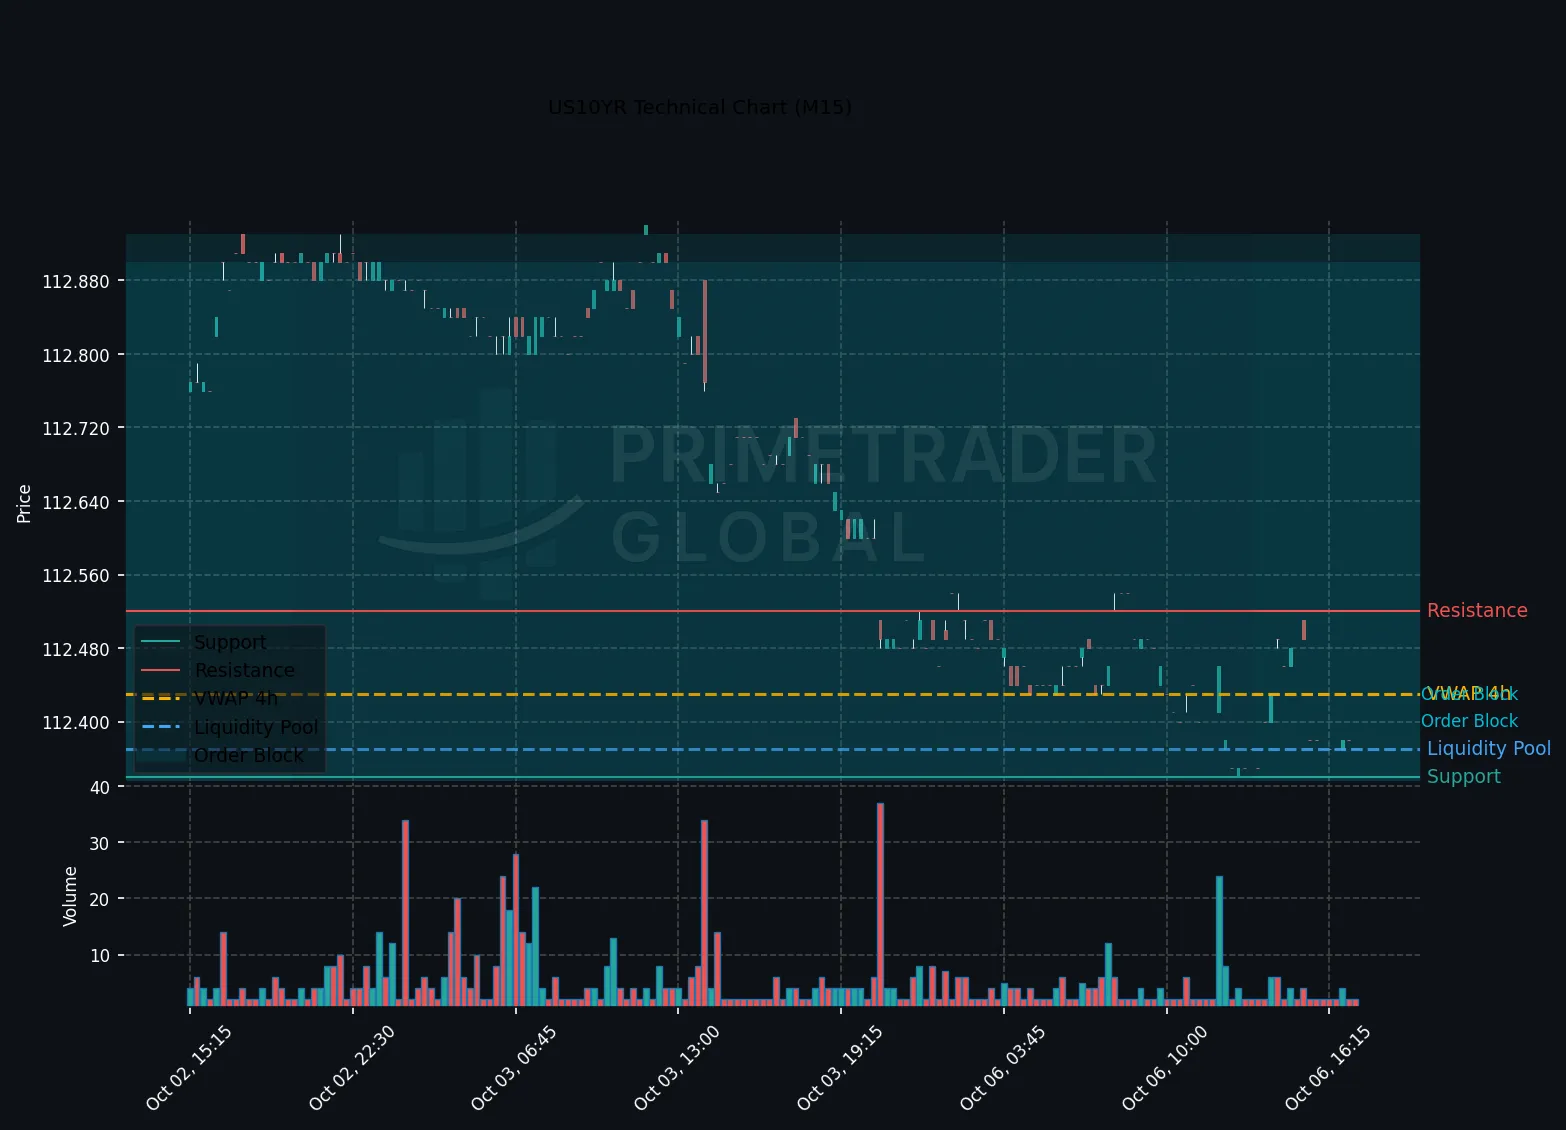
In today’s US session, the US10YR yield succumbed to further bearish pressure as the H1 trend maintained a clear downward trajectory. This shift occurs within the context of an emerging risk-off sentiment across markets, even in the absence of substantial news catalysts. Short-term charts aligned with a bearish signal, indicating a potential pivot in trading dynamics.
Macro Drivers
The prevailing risk-off tone reflects broader concerns in the market, where investors are adopting a cautious stance. Despite long-term bullish sentiment, the current environment has prompted traders to reassess positions, particularly in fixed income, leading to increased bearishness in near-term trades.
Key Technical Anchors
Current technical levels suggest a clear focus on price action. Support is firmly established at 112.35, while resistance is marked at 112.91. A failure to reclaim the resistance level may perpetuate downward pressure, reinforcing the bearish bias predominantly suggested by short-term indicators.
Cross-Asset Signals
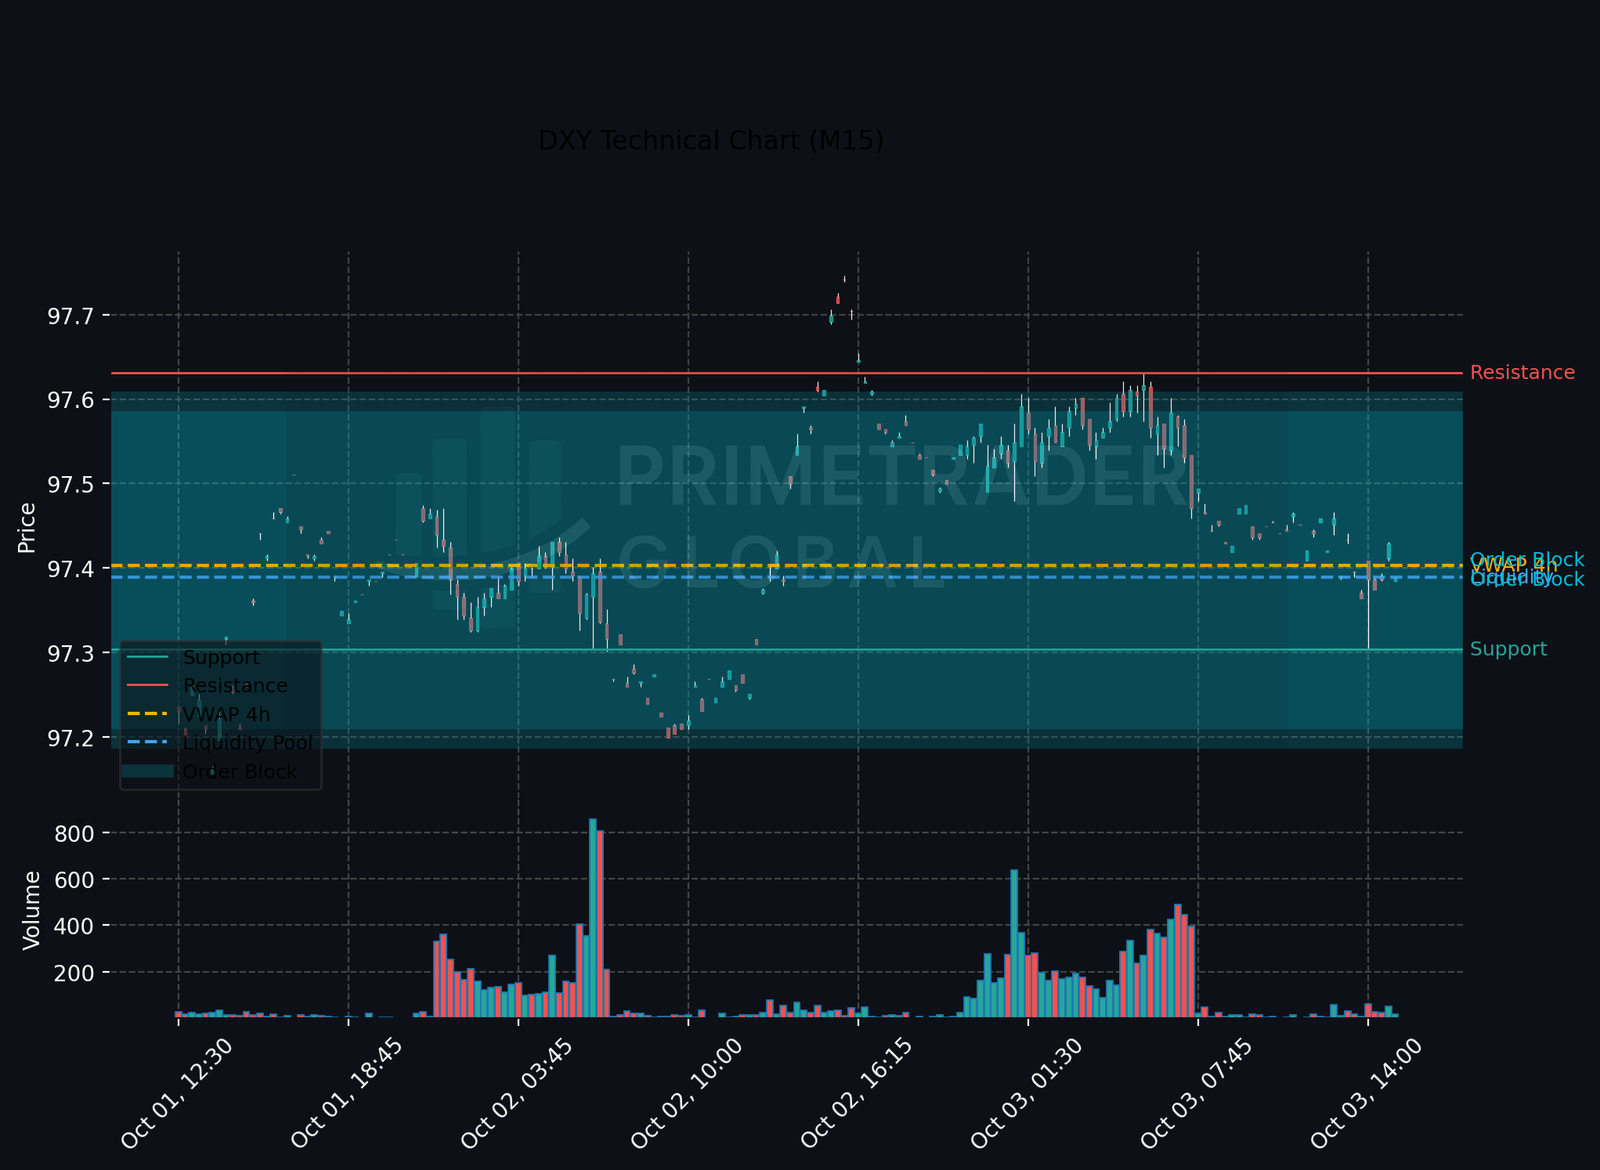
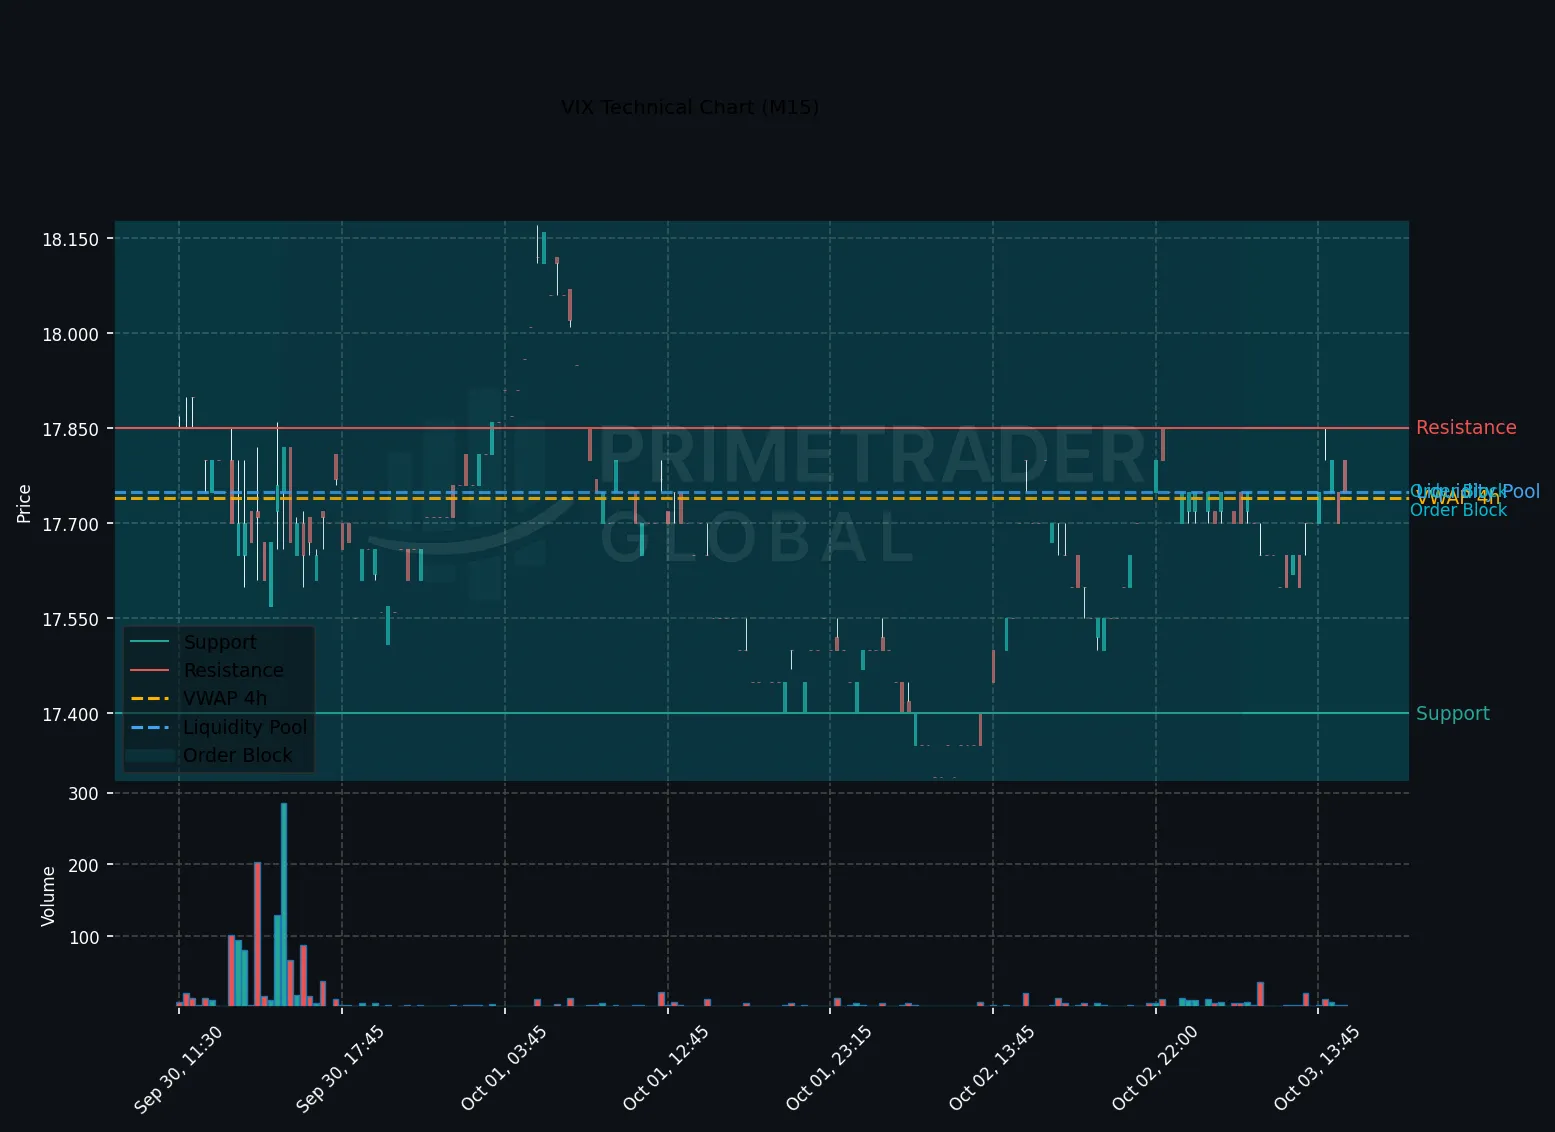
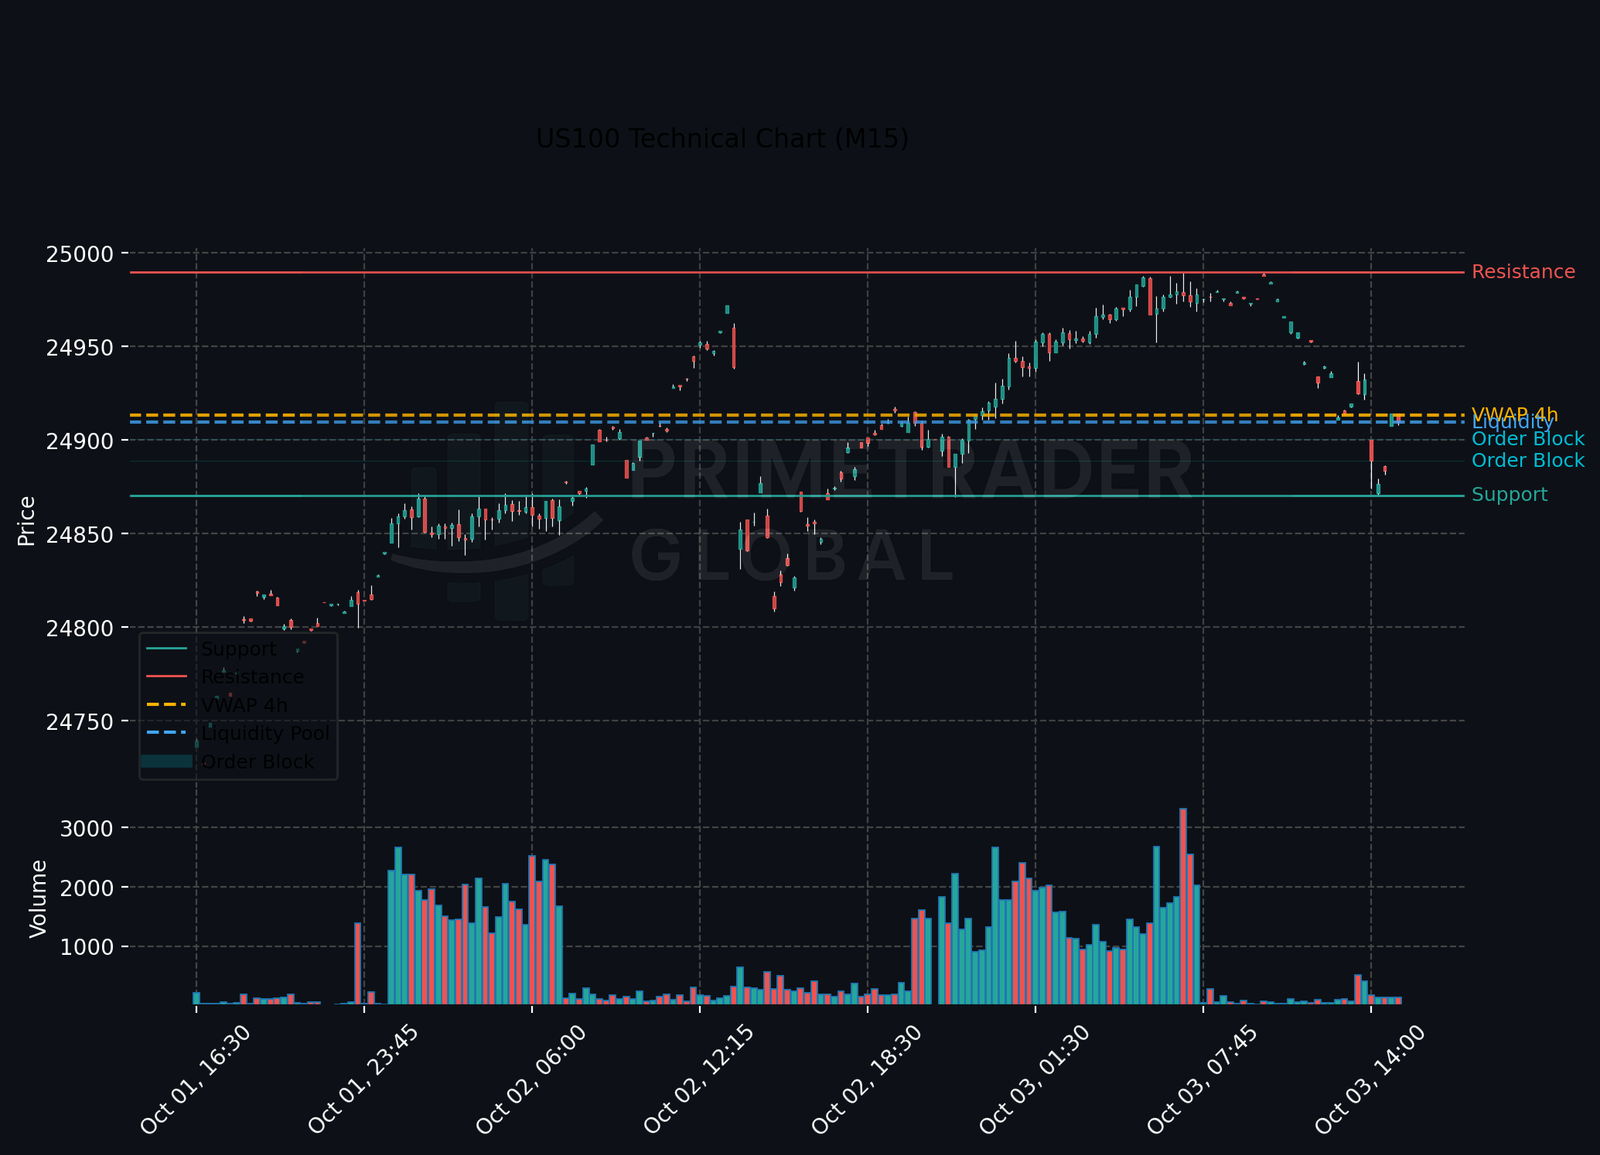
Additional market indicators corroborate the US10YR bearish outlook, with equities exhibiting vulnerability and safe-haven assets gaining traction. This cross-asset relationship may further drive flows into Treasury bonds as risk appetite diminishes, highlighting a pivotal period for institutional positioning.
Forward Outlook
The probability outlook presents a multifaceted view: A **Bullish (11%)** scenario could unfold if yields manage to break above 112.91, potentially indicating an upside continuation. A **Neutral (48%)** range is anticipated between 112.35 and 112.91 as markets digest current signals. Conversely, a **Bearish (40%)** situation would materialize if yields fall below 112.35, suggesting potential for extended losses. Monitoring these levels will be crucial for strategic adjustments in positioning.
Prime Trader Global | AI Market Intelligence | All insights derived from factual market data.