2025-10-31 03:27 UTC
Lead Overview
The US500 remained neutral during the Asian session, with H1 price action indicating a flat-to-choppy environment. Multi-timeframe signals appear mixed, contributing to a neutral macro bias. The surge in Amazon shares, prompted by renewed AI interest, boosts sectoral risk-on sentiment without altering the overall market stance. Current macro dynamics hint towards positioning within a defined trading range, anticipating potential neutral-to-bearish shifts.
Macro Drivers
No significant scheduled events are influencing the current session. The market’s attention remains on corporate earnings and sector-specific moves, such as the impact of Amazon’s positive performance. Despite the absence of broad economic data, these micro developments underscore a cautious approach pending further catalysts.
Key Technical Anchors
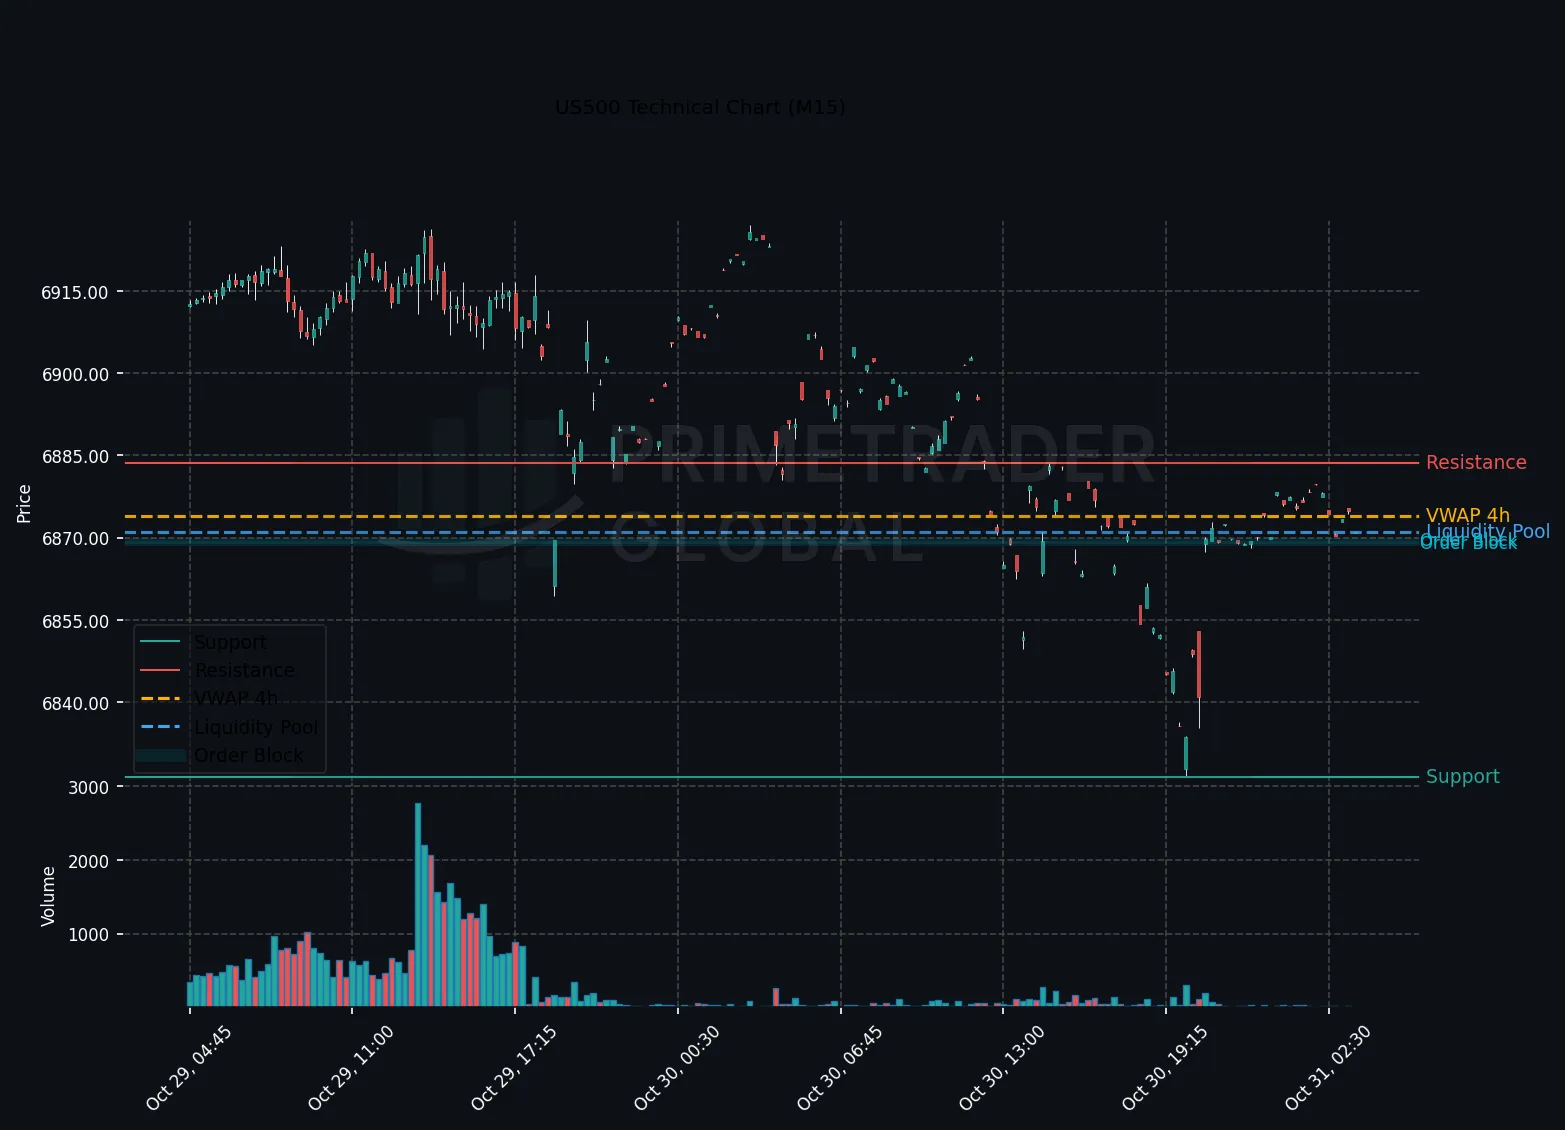
A critical resistance level is delineated at 6923.7, with a lower support threshold at 6826.45. The market’s behavior relative to these technical anchors will provide directional cues, particularly if deviations from the prevailing range-bound trend emerge amidst broader sentiment shifts.
Cross-Asset Signals
Mixed alignment across multiple timeframes indicates a heightened potential for range-bound trading. Amazon’s influence bears watching as a sector leader, potentially driving targeted risk sentiment without necessarily shifting the broader market narrative. Cross-asset correlations remain subdued, with the absence of decisive leads from major currency pairs or fixed income markets.
Forward Outlook
Given the current market landscape, the US500 is likely to experience range-bound movement, maintaining a neutral-to-bearish outlook. A break below the 6826.45 support could exacerbate downside volatility, while overcoming 6923.7 resistance might trigger upside continuation. Institutional focus will remain on tactical trades within these parameters, emphasizing the strategic timing of entries and exits.
Prime Trader Global | AI Market Intelligence | All insights derived from factual market data.