2025-10-31 03:27 UTC
Lead Overview
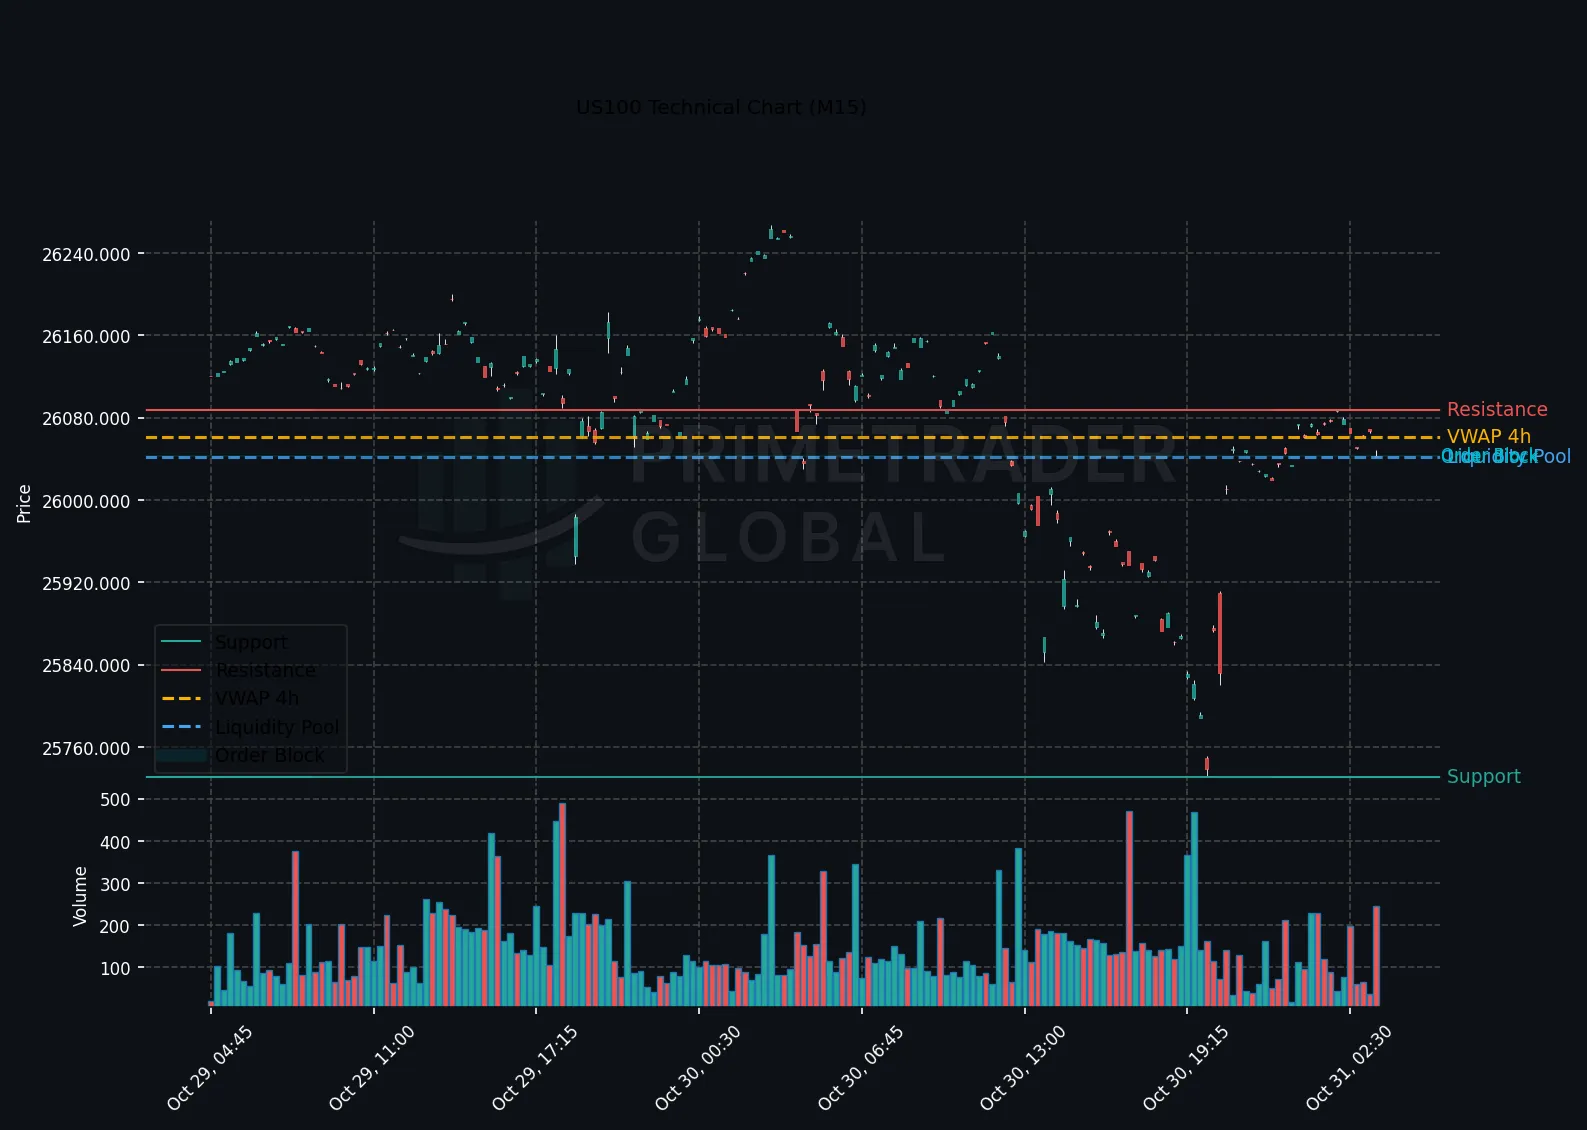
During the Asian session, the US100 index has continued to track within an hourly range-bound trend, reflecting a mixed multi-timeframe alignment. This constrained movement underscores a neutral macro bias, absent any significant scheduled events to influence direction. Notably, Amazon’s explosive performance, nearing its best since 2022 on renewed AI optimism, has injected positive sentiment into the tech sector, momentarily lifting pressures upward. However, forward projections skew bearish, with defensive and range-bound positioning advised unless a decisive hourly breakout occurs.
Macro Drivers
The overarching macro environment remains stable with no imminent catalysts to disrupt current trends. Amazon’s resurgence within the tech landscape underscores rising optimism around AI capabilities, yet the broader macro context keeps traders cautious, favoring conservative setups amidst heightened short-term volatility.
Key Technical Anchors
Technically, the US100 is situated firmly between support at 25731.31 and resistance at 26258.06 on the H1 timeframe. A sustained move beyond these bounds is required to validate a directional bias, with current market alignment suggesting a propensity towards range continuity.
Cross-Asset Signals
Across the board, signals align with cautious optimism stemming from Amazon’s performance, but are tempered by macro stability and lack of broader market catalysts. Immediate cross-asset engagements portray subdued volatility, with significant movements likely contingent on developments in broader equity trends or macroeconomic releases.
Forward Outlook
Looking ahead, the US100 maintains a bearish outlook with about 65% probability of further declines, particularly if pivotal support at 25731.31 is breached, possibly triggering extended losses. Conversely, a 25% chance exists for a bullish reversal should resistance at 26258.06 be overcome, leaving a narrow 9% likelihood of continued range-bound tightness. Institutional traders are advised to monitor these levels for tactical entries.
Prime Trader Global | AI Market Intelligence | All insights derived from factual market data.