2025-10-09 16:41 UTC
Lead Overview
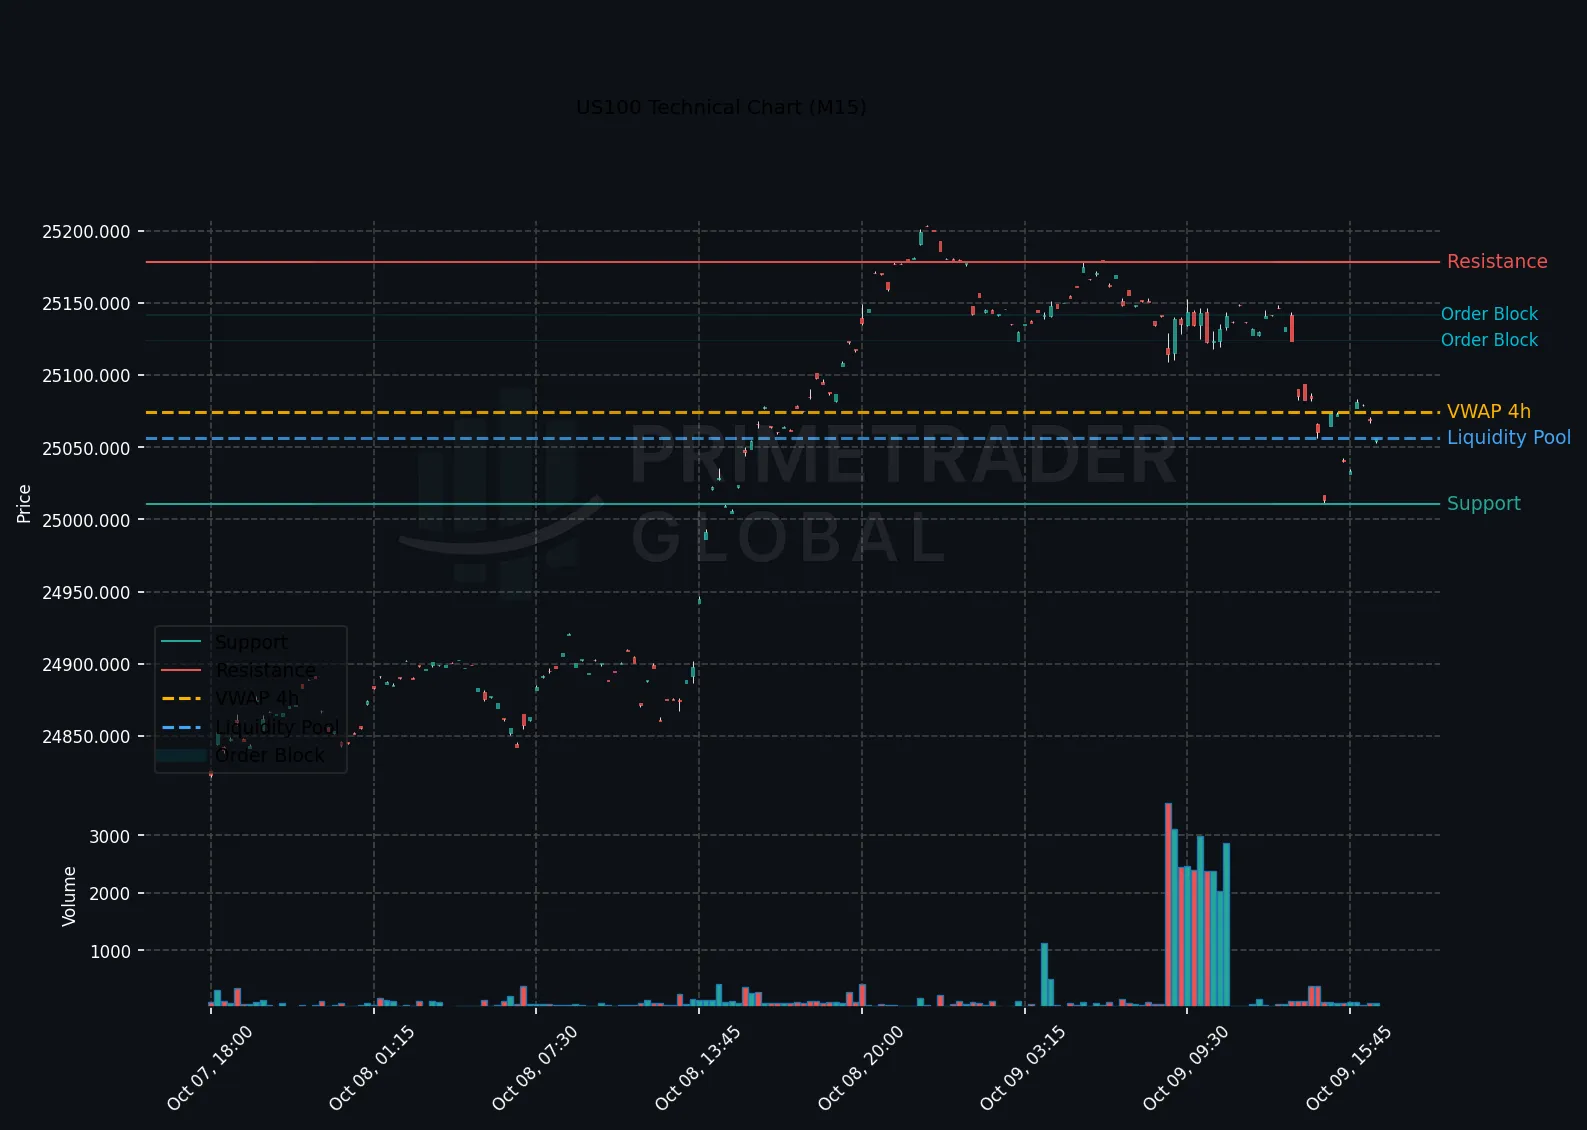
The US100 index continues to exhibit a bullish trajectory during the US session, upheld by a robust H1 bullish trend and an overall Emerging Risk-On macro environment. Delta’s impressive stock rally, fueled by soaring travel demand and record-breaking revenue figures, is significantly bolstering risk-on flows and providing upward momentum for the index. However, caution is advised as the Preliminary University of Michigan (UoM) Inflation Expectations report looms, posing potential volatility triggers that might challenge the current upward drive.
Macro Drivers
Delta’s recent performance surge due to increased travel demand is a major macro driver, feeding into broader risk-on sentiment supportive of the US100 index’s bullish stance. This dynamic is unfolding amid a global landscape readying itself for the upcoming UoM Inflation Expectations report, which could influence market sentiment and reposition asset flows depending on the inflation outlook portrayed.
Key Technical Anchors
The key technical levels to observe include the support at 24,821.6 and resistance at 25,192.65. A bullish continuation could be seen if the index decisively breaks above the resistance, whereas a dip below the support might lead to an extended downside correction. The H4 and H1 charts remain strongly bullish, contrasting with a potential short-term counter-move suggested by the M15 chart.
Cross-Asset Signals
Delta’s stock momentum is a critical cross-asset signal reinforcing the current trend in the US100 index. Furthermore, the broader travel and airline sectors are showing signs of revival, potentially influencing related equity sectors and risk sentiment positively. The forthcoming UoM report could realign these signals, impacting correlated asset classes depending on its outcome.
Forward Outlook
Looking ahead, the market is pricing in multiple scenarios: a bullish scenario with a 42% probability that sees a continuation beyond 25,192.65, a neutral scenario (47% probability) maintaining a range between 24,821.6 and 25,192.65, and a bearish scenario (11% probability) that anticipates a dip below 24,821.6 leading to further losses. The immediate reaction to the UoM Inflation Expectations report will be pivotal in confirming or altering this positioning.
Prime Trader Global | AI Market Intelligence | All insights derived from factual market data.