Lead Overview
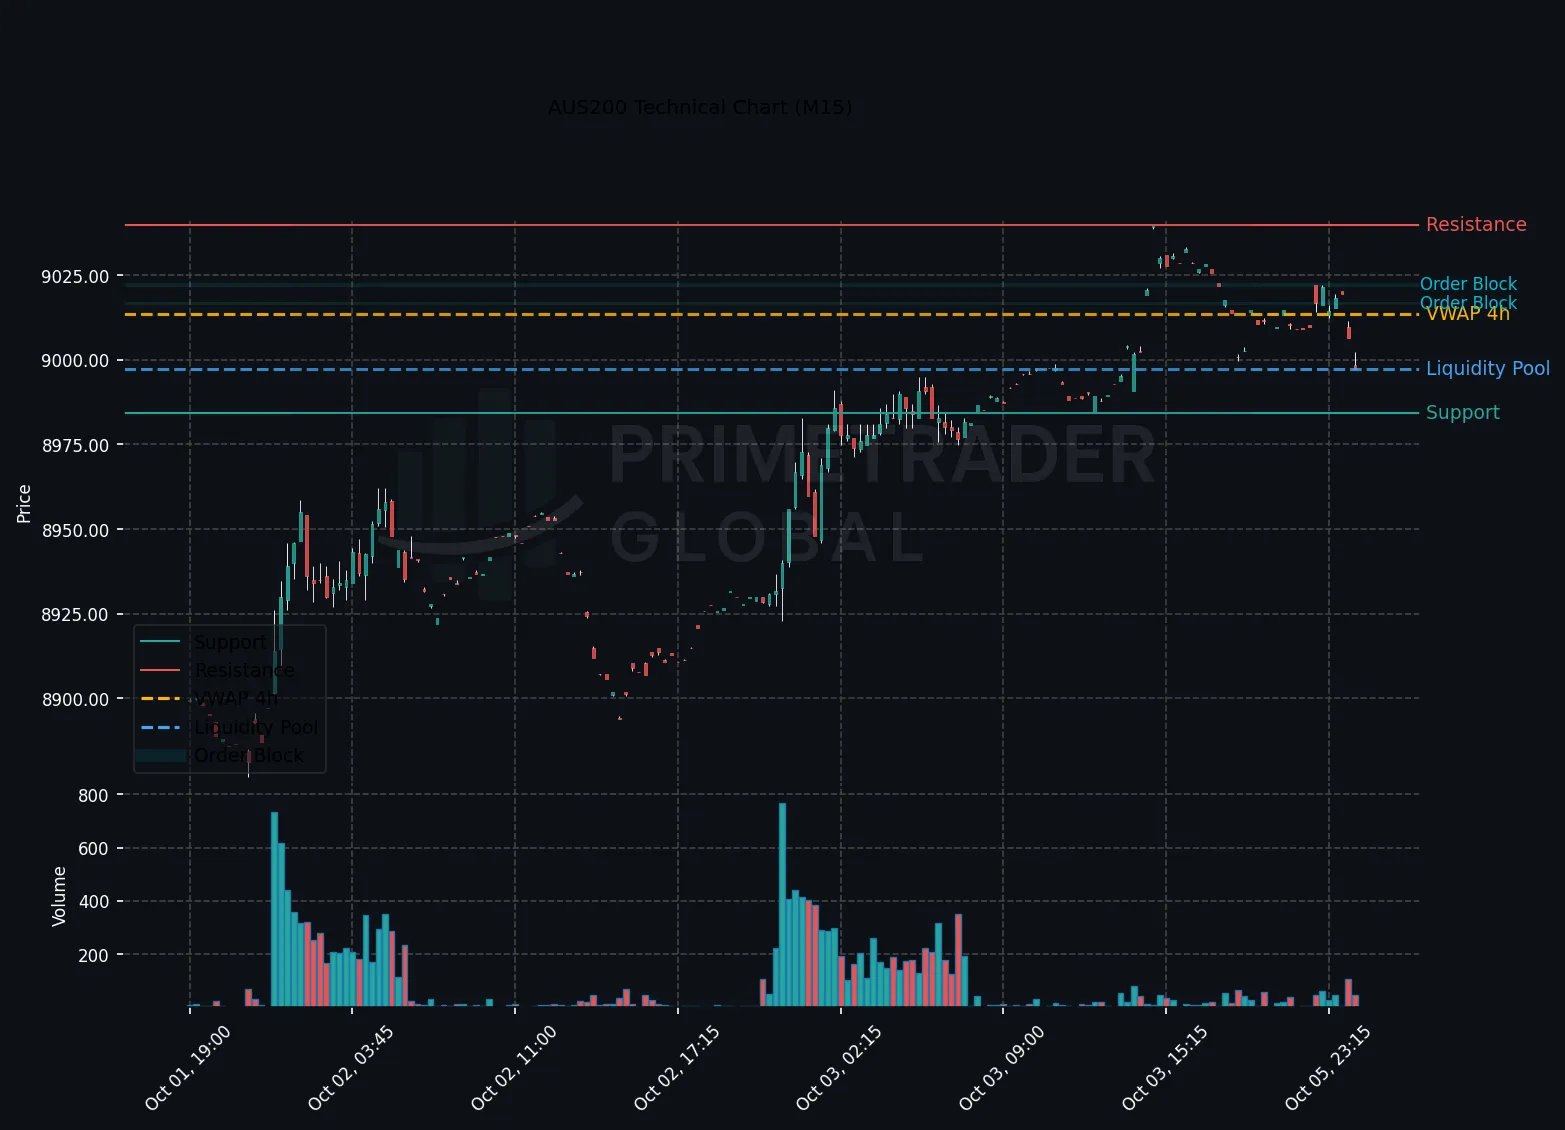
AUS200 is currently trading with a bullish bias, reflecting a 38% confidence level as it approaches pivotal price levels. Traders are attuned to macroeconomic catalysts that may influence market direction amidst stable market conditions.
Macro Drivers
The AUS200 remains sensitive to broader market dynamics, characterized by a balanced volatility profile (RR Profile: Up=3.23, Down=0.31). While no major calendar data is scheduled, the absence of significant macroeconomic announcements suggests that regional and global market sentiment will dominate price movements. Correlation with other indices remains notable, particularly with the EURO50 (0.497) and UK100 (0.489), indicating potential spillover effects on sentiment.
Key Technical Anchors
Key technical levels are crucial for traders currently engaged in AUS200. The liquidity pool can be observed at 8997.29, with significant order blocks identified at 9022.09 and 9016.59. The daily Volume Weighted Average Price (VWAP) is recorded at 9000.92, while the 4-hour VWAP stands at 9013.54, and the cumulative VWAP indicates support beginning at 8824.26. Maintaining price action above these levels could affirm the bullish outlook.
Cross-Asset Signals
In terms of cross-asset signals, the AUS200’s correlations with major indices suggest potential influences from movements in global equities, particularly the US500 (0.383) and GER40 (0.395). As these indices react to macroeconomic developments, traders should monitor their movements for implications on AUS200’s trajectory.
Forward Outlook
The forward outlook for AUS200 indicates likely range-bound action until a decisive breakout occurs. Traders should configure their strategies around the established key levels and potential shifts in sentiment driven by market conditions. Continued monitoring of macro drivers and cross-asset interactions will be vital in forming an adaptive trading strategy.
Prime Trader Global | AI Market Intelligence | All insights derived from factual market data.