2025-10-27 21:44 UTC
Lead Overview
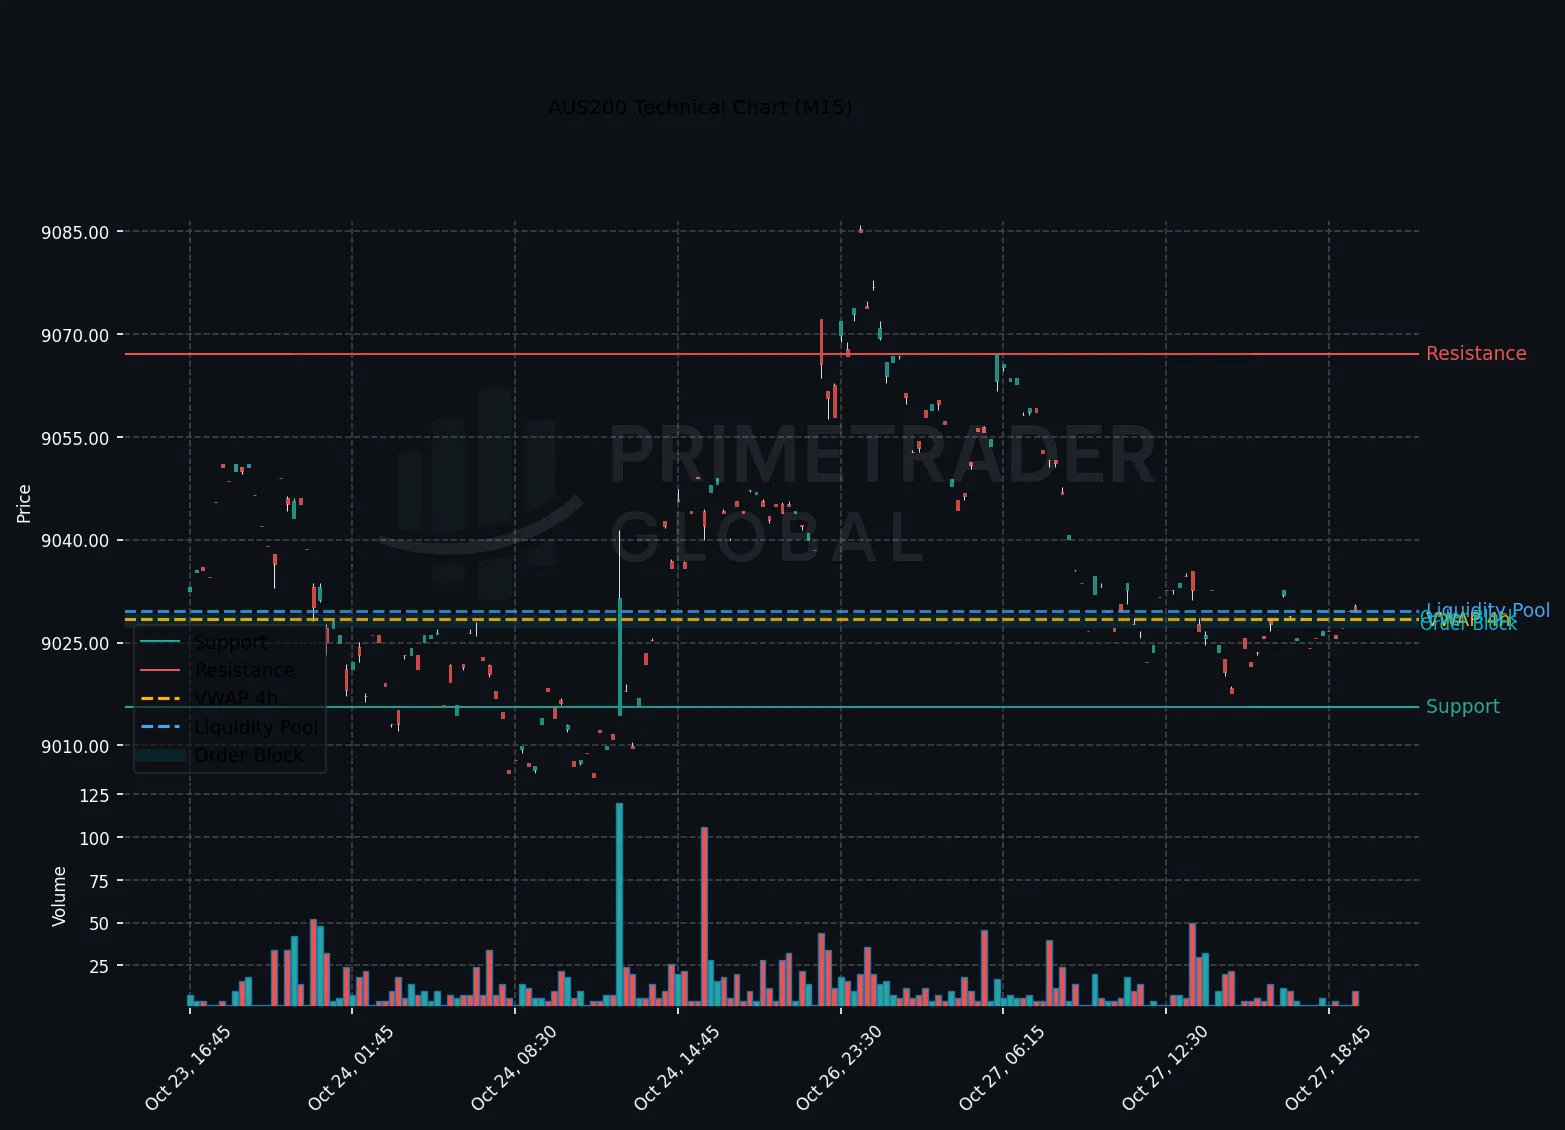
The AUS200 index remains largely range-bound during the US session, reflecting a nuanced balance in risk sentiment. Predominantly driven by its H1 chart, the index maintains an elevated probability of bullish continuation at 83%. However, market participants should note the mixed macro signals, with Trump’s decision reversal on furloughed workers adding to defensive stances and tamping down volatility.
Macro Drivers
Macro influences are muted, with no major economic data releases slated that could sway the current neutral bias. Political developments in the U.S., particularly Trump’s policy pivots, could potentially influence risk assets, although their immediate impact seems limited to sentiment shifts rather than directional bias on the AUS200.
Key Technical Anchors
The AUS200 continues to trade in a confined range, with support firmly established at 9006.94 and resistance at 9073.85. A decisive break above the resistance could catalyze an upward trajectory, aligning with the higher probability of bullish scenarios posited. Conversely, a breach below support may open the door for increased bearish pressure, though this is deemed less likely at present.
Cross-Asset Signals
Cross-asset correlations remain subdued, with limited directional cues from broader equity, bond, or currency markets. The risk-off tilt seen with defensives gaining ground suggests a careful approach, reinforcing the range-bound expectations that currently prevail. The propagation of risk sentiment shifts, notably through U.S. policy moves, remains a potential disruptor.
Forward Outlook
Looking ahead, maintaining vigilance on the 9073.85 resistance level is crucial for traders positioning in line with the anticipated bullish momentum. Should macro developments or unforeseen events drive a break above this level, a reevaluation of upside targets may be necessary. Meanwhile, with a solid floor at 9006.94, tactical plays may emphasize on managing exposures within this established range.
Prime Trader Global | AI Market Intelligence | All insights derived from factual market data.