2025-10-10 09:21 UTC
Lead Overview
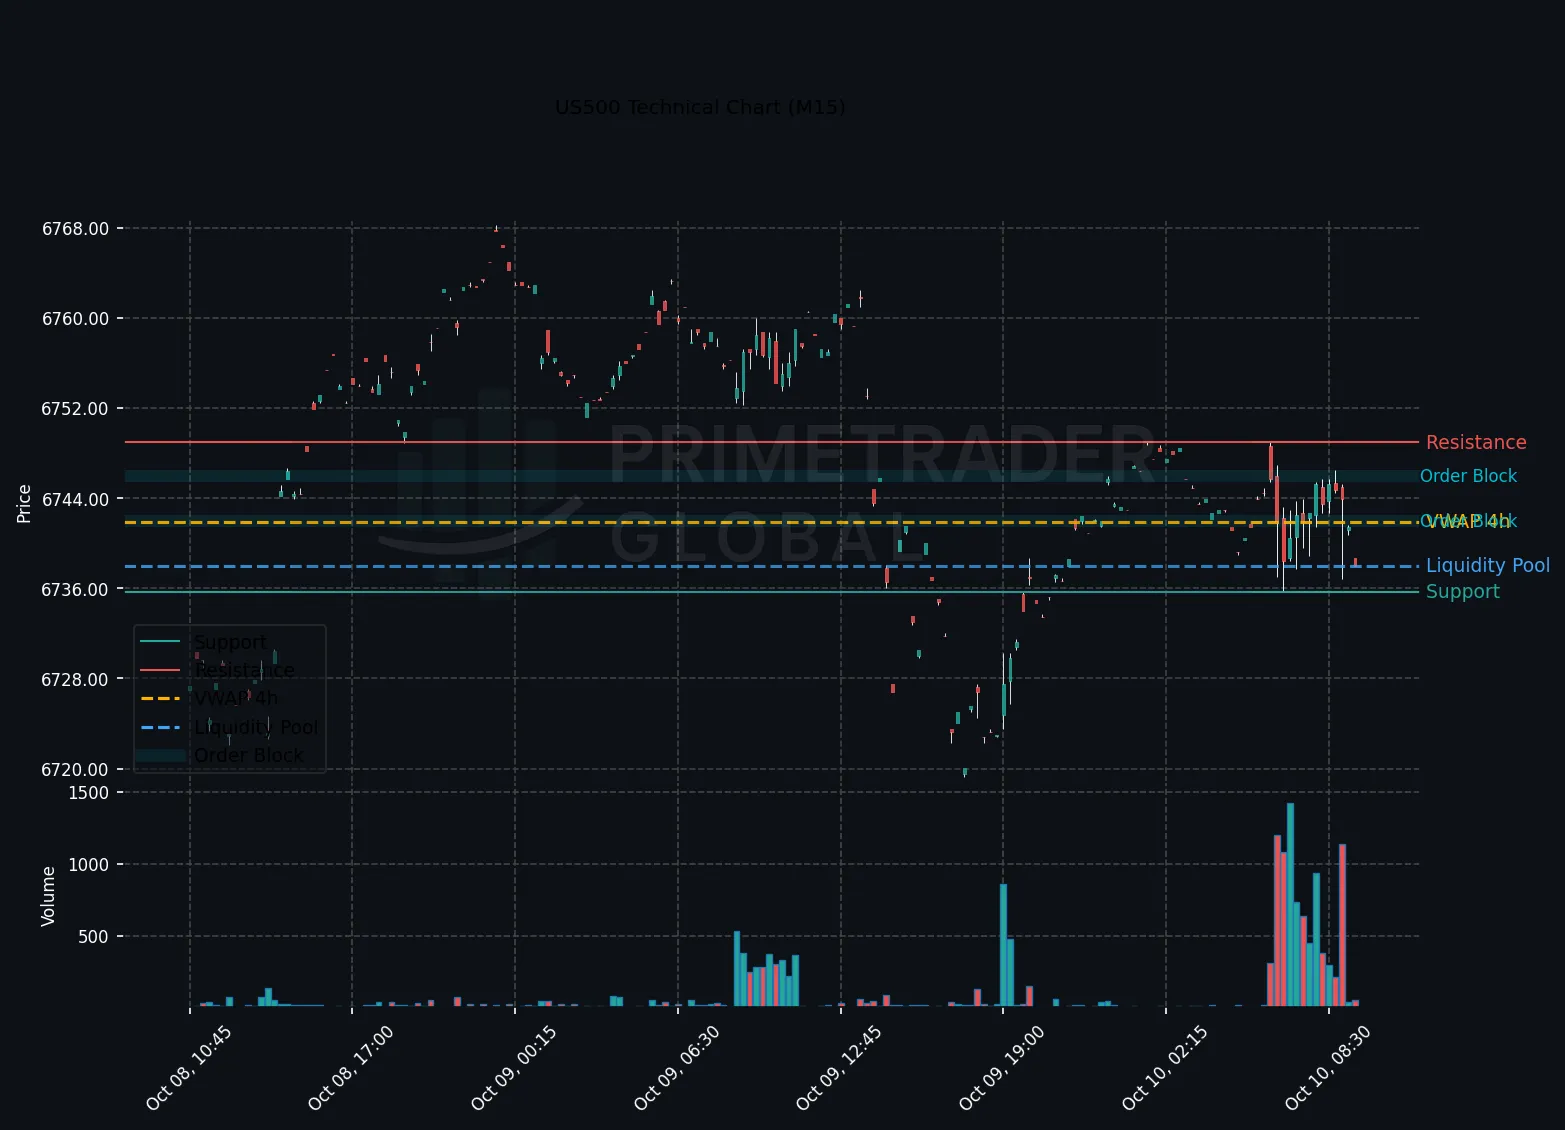
The US500 continues to hold in a neutral range during the European session, poised between the critical levels of 6718.1 and 6764.94. Traders remain cautious ahead of the Prelim UoM Inflation Expectations report, which could trigger intraday volatility. Despite this, the market tone is subtly bearish, with a 45% probability for a downside continuation should the index breach the 6718.1 support level.
Macro Drivers
The US500’s current positioning reflects a mixed macro outlook exacerbated by anticipation around key economic data. The Prelim UoM Inflation Expectations report, due later, serves as a potential catalyst for market movement, while extraneous sentiment impacts, such as media coverage of John Goodman’s property sale, complicate the sentiment landscape.
Key Technical Anchors
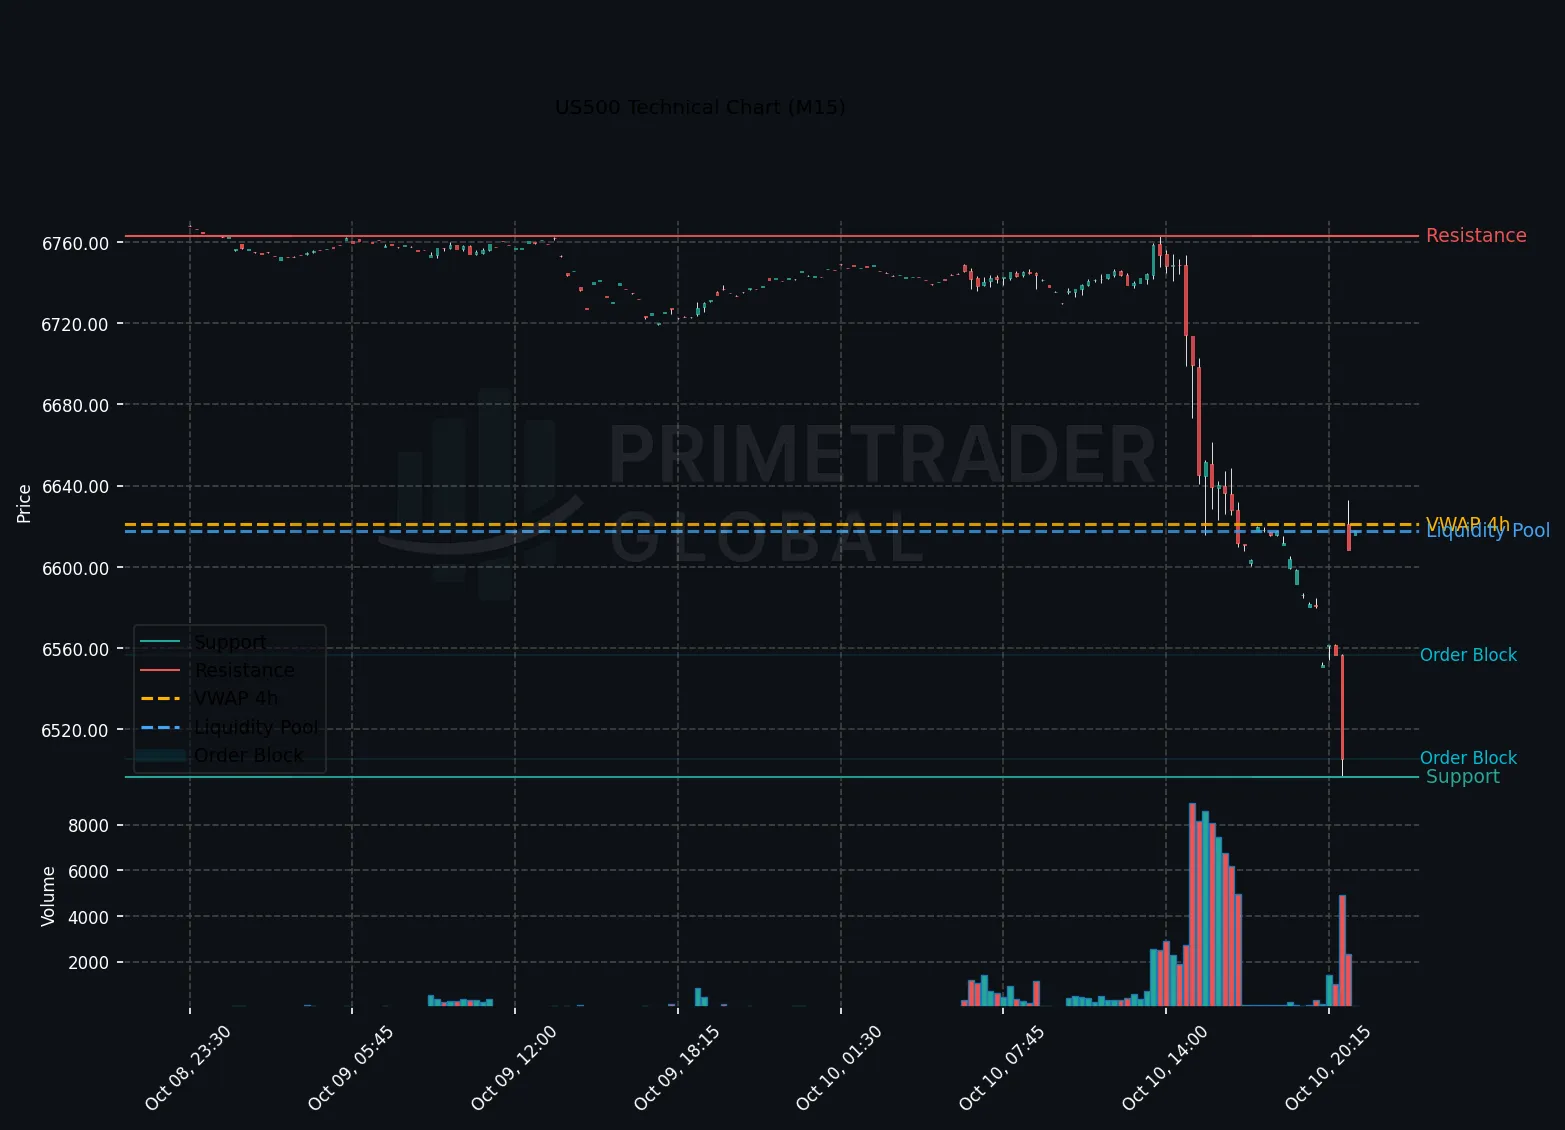
Technical analysis identifies support at 6718.1 and resistance at 6764.94 for the US500. A stable range below the resistance level highlights the neutral short-term outlook, although sustained movement below 6718.1 could confirm a more bearish trajectory.
Cross-Asset Signals
Cross-asset market signals suggest a cautious stance from traders across risk assets. The subdued volatility in other major indices aligns with the range-bound behavior observed in the US500. This environment underscores the broader uncertainty permeating financial markets, as participants await more definitive macroeconomic signals.
Forward Outlook
Looking ahead, the US500 will likely continue trading within its established range without significant catalysts to shift momentum dramatically. However, a decisive move below 6718.1 would amplify bearish pressures, potentially catalyzing a further sell-off. Market participants should monitor pre-release trends and any notable shifts in macroeconomic indicators closely, refining their strategies accordingly.
Prime Trader Global | AI Market Intelligence | All insights derived from factual market data.