2025-10-15 18:56 UTC
Lead Overview
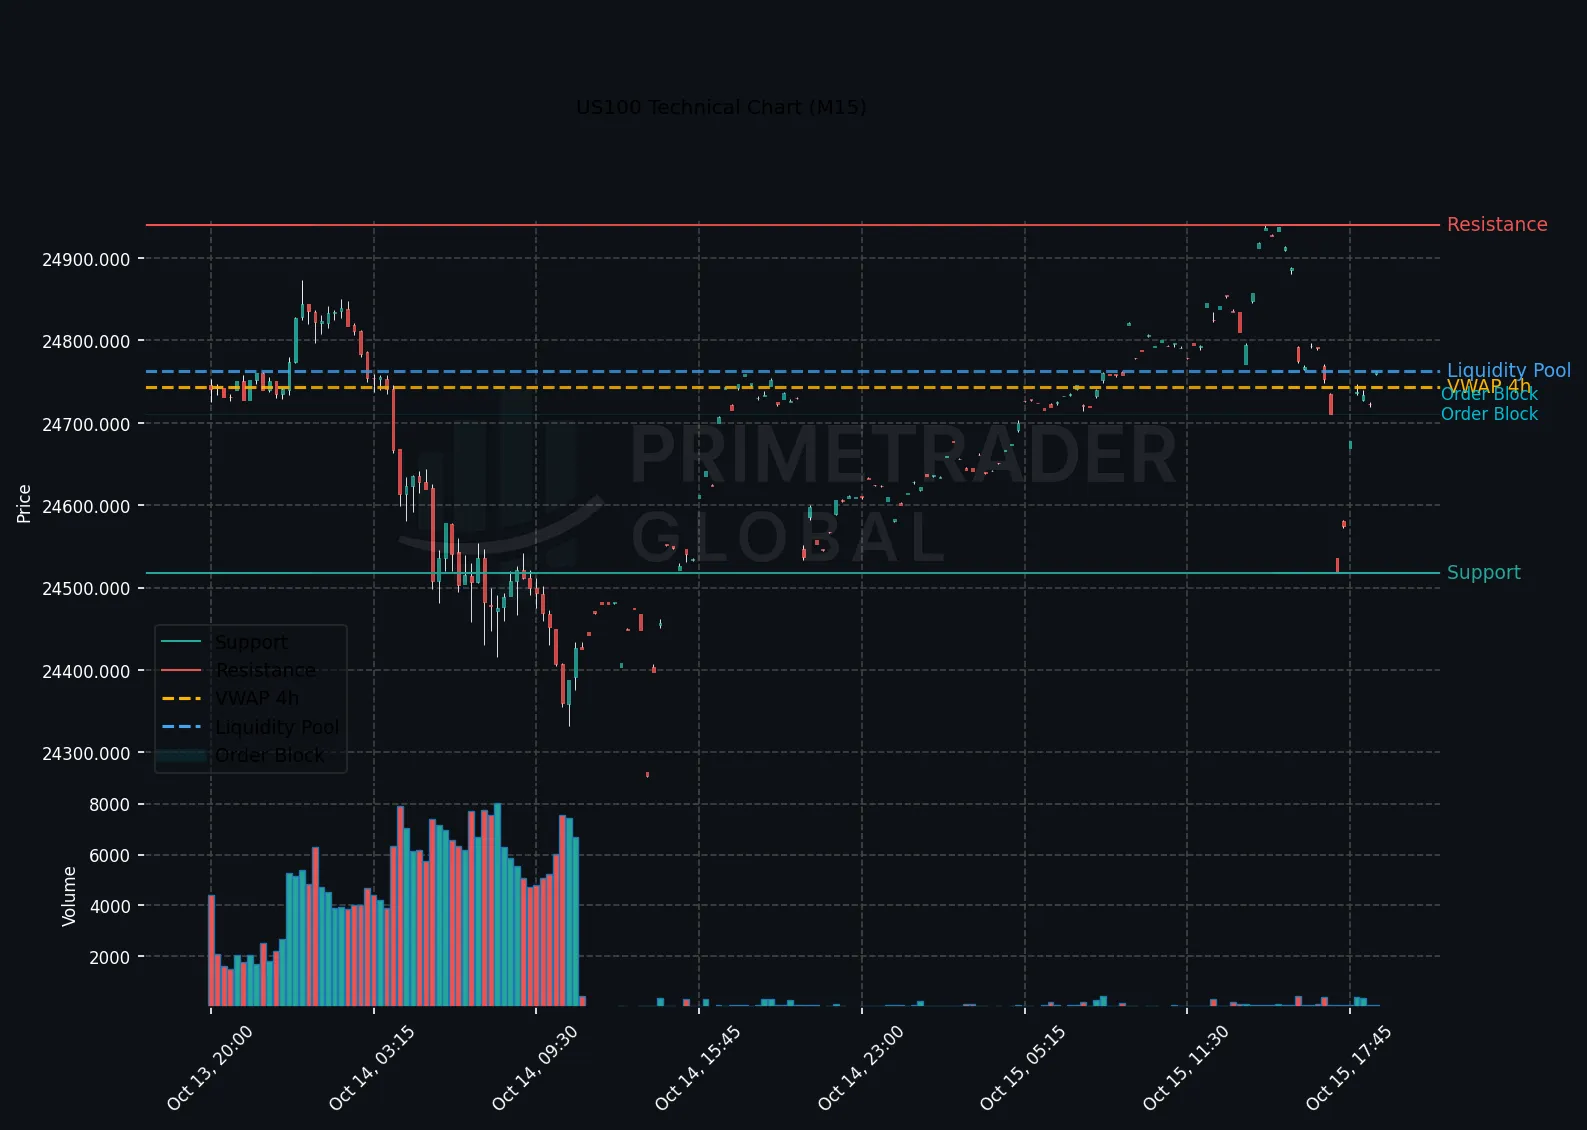
The US100 index is exhibiting a distinctly bullish short-term trend as traders look toward FOMC member Waller’s upcoming speech for guidance. Currently, the H1 and M15 charts suggest strong bullish momentum, contrasting with a broader bearish stance on higher timeframes. Market participants are also mindful of energy sector dynamics, particularly in light of recent headlines regarding former President Trump’s interventions in coal industry policies. The forward scenario probabilities reflect a nuanced market perception, with 41% leaning bullish, 48% neutral, and 11% bearish. A critical level to watch is a potential breakout above 24937.84, which may signal further upward movement.
Macro Drivers
The primary macro drivers for the US100 lie in impending cues from the Federal Reserve, with particular attention on FOMC member Waller’s statements regarding interest rates and their implications for technology stocks. Concurrently, the political discourse around energy policy—especially concerning coal—adds another dimension to market sentiment, though its immediate impact on the US100 remains circumscribed to risk appetite shifts.
Key Technical Anchors
Technical analysis identifies a key support level at 24332.16 and resistance at 24937.84. Investors should be apt to re-evaluate their positions should these levels experience a break, as they heavily influence the evolving technical framework. The alignment of H1 and M15 as strong bullish underscores a tight watch on these levels for potential continuation or reversal signals.
Cross-Asset Signals
Cross-asset movements suggest a general risk-on sentiment, particularly in equities and emerging markets, which aligns with short-term bullish trends. Yet, traders should remain cautious as macroeconomic indicators and central bank communications can swiftly alter these dynamics. The energy sector remains a wildcard, with coal policy debates offering potential for sector-specific volatility.
Forward Outlook
Looking forward, a breakout above 24937.84 could pivot market bias toward strong bullish opportunities, aligning with the 41% bullish probability scenario. Meanwhile, maintaining a range-bound movement between established support and resistance could designate a period of consolidation, reflected in the 48% neutral outlook. A breach below 24332.16 would pivot focus to the less probable bearish trajectory, demanding acute readiness to adjust exposures accordingly.
Prime Trader Global | AI Market Intelligence | All insights derived from factual market data.