2025-10-15 18:56 UTC
Lead Overview
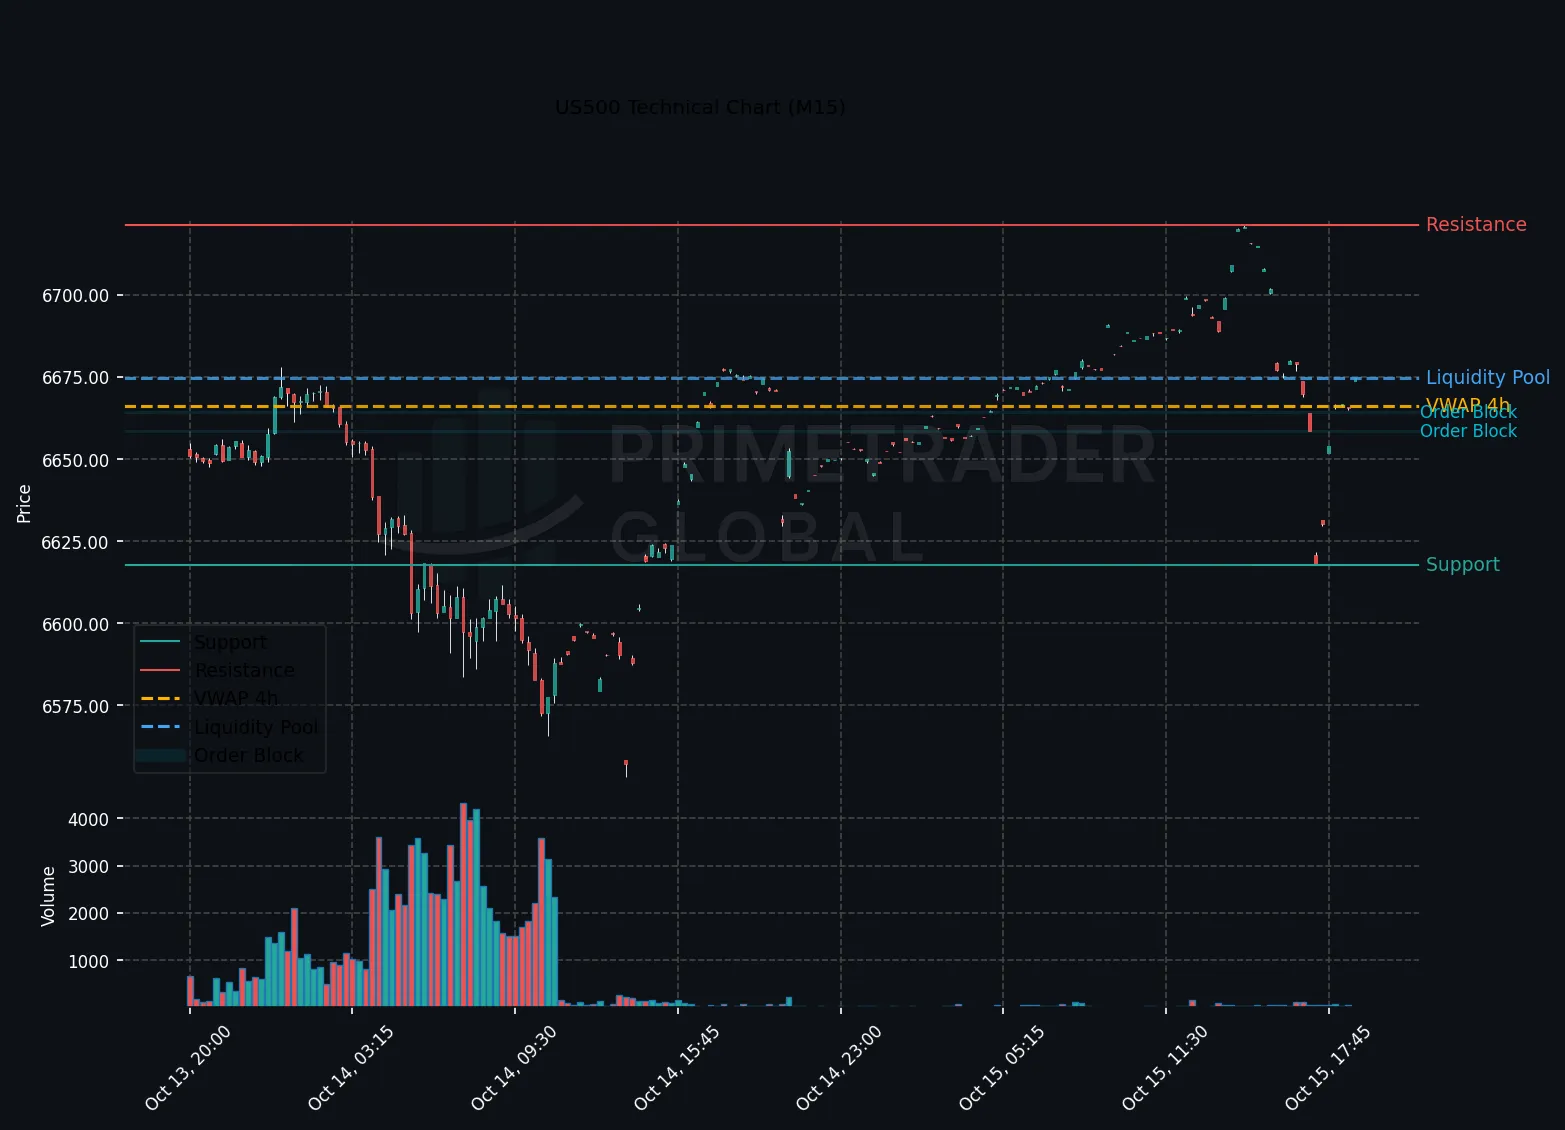
The US500 index currently demonstrates an H1 uptrend within an emerging risk-on macro perspective. This trend persists despite mixed alignment across various timeframes, which suggests that range-bound trading could still surface. Market participants are focusing on the forthcoming comments from FOMC member Waller, which have the potential to trigger intraday volatility. Political developments, including Trump’s impact on the energy sector, also weigh on market sentiment, notably boosting energy and cyclical flows.
Macro Drivers
The macro environment remains cautiously bullish as upcoming remarks from FOMC member Waller could influence investor sentiment and potentially guide monetary policy expectations. Furthermore, geopolitical shifts, particularly in US energy policy, are maintaining a bid on cyclical sectors, providing a supportive backdrop for risk assets.
Key Technical Anchors
Critical technical levels for the US500 are observed with immediate resistance at 6714.86. A successful breach of this level could indicate an upside continuation. Conversely, support is firmly placed at 6565.73, below which bearish pressures may intensify.
Cross-Asset Signals
Across the board, cross-asset relationships reveal a constructive environment for risk assets. Energy commodities are witnessing tailwinds from political developments, while fixed income markets remain watchful of any dovish or hawkish steer from upcoming Fed communications.
Forward Outlook
The forward positioning suggests a neutral-to-bullish stance with a 41% probability of a bullish breakout should US500 breach the 6714.86 threshold. Traders are advised to maintain cautious position sizing, acknowledging the mixed timeframe alignment and the potential influence of geopolitical headlines and FOMC remarks. The potential range trading between 6565.73 and 6714.86 also remains a distinct possibility.
Prime Trader Global | AI Market Intelligence | All insights derived from factual market data.