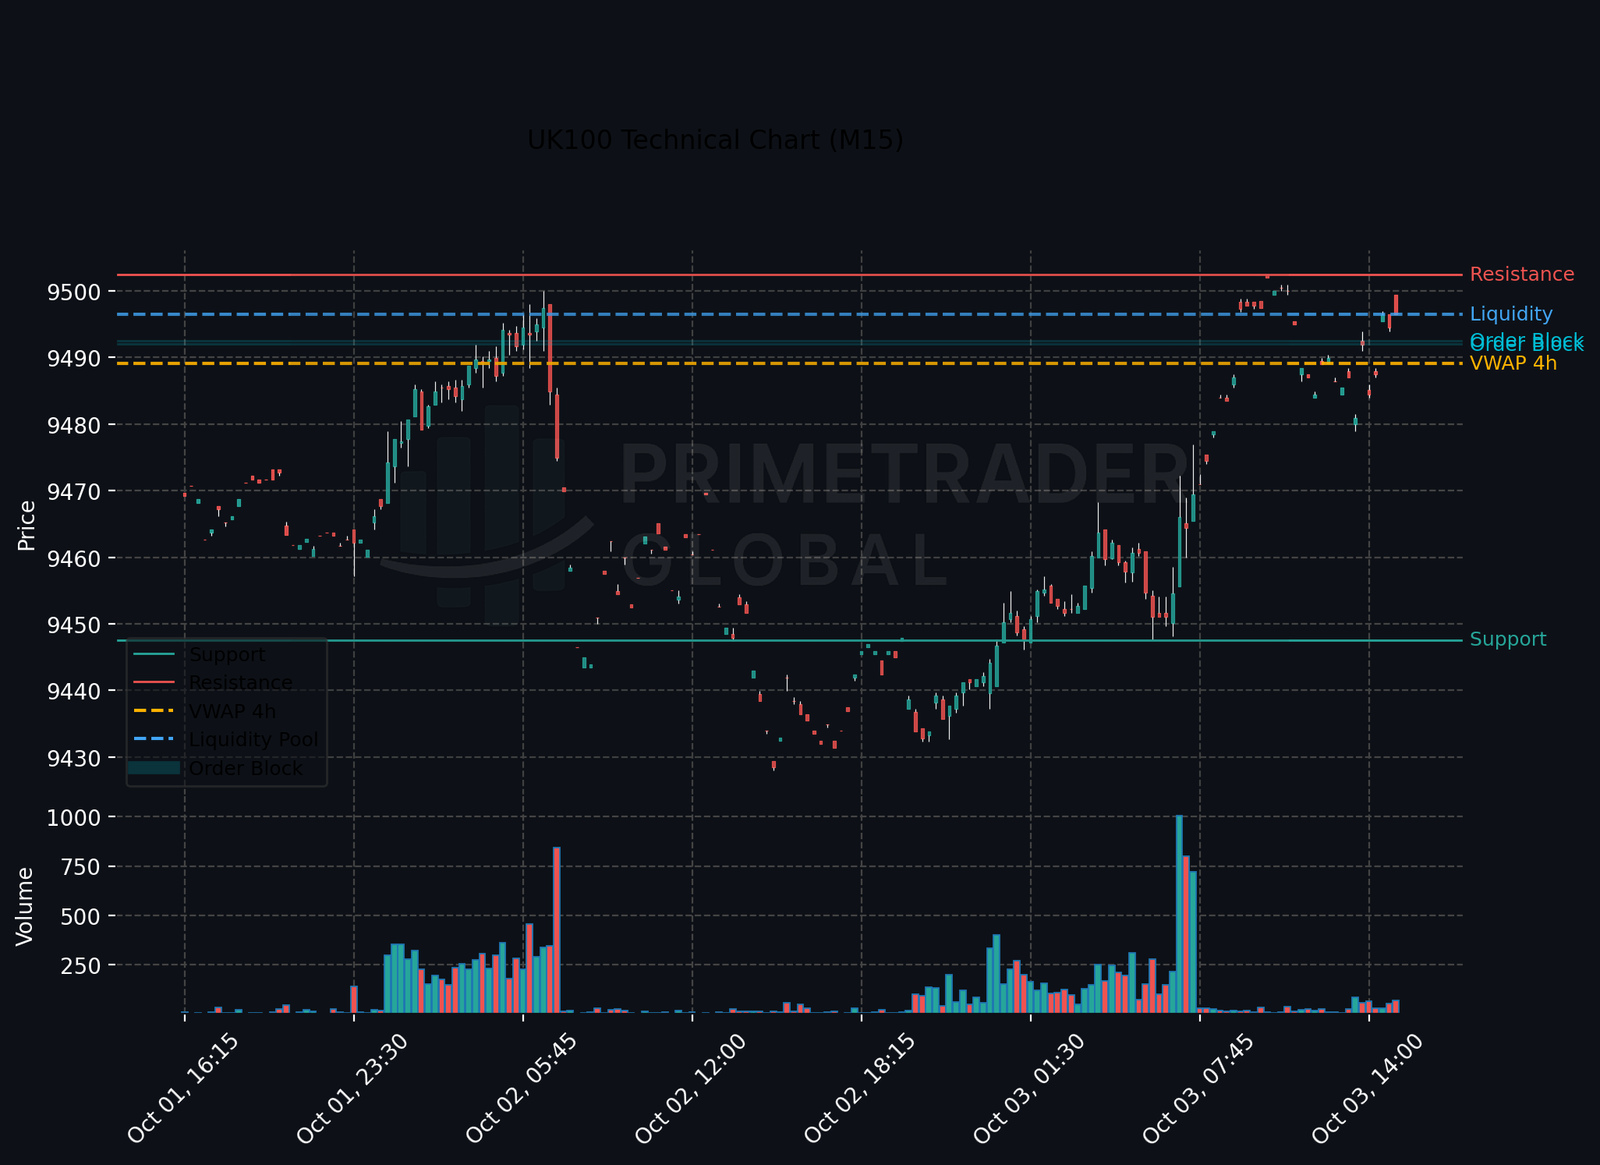
Lead Overview
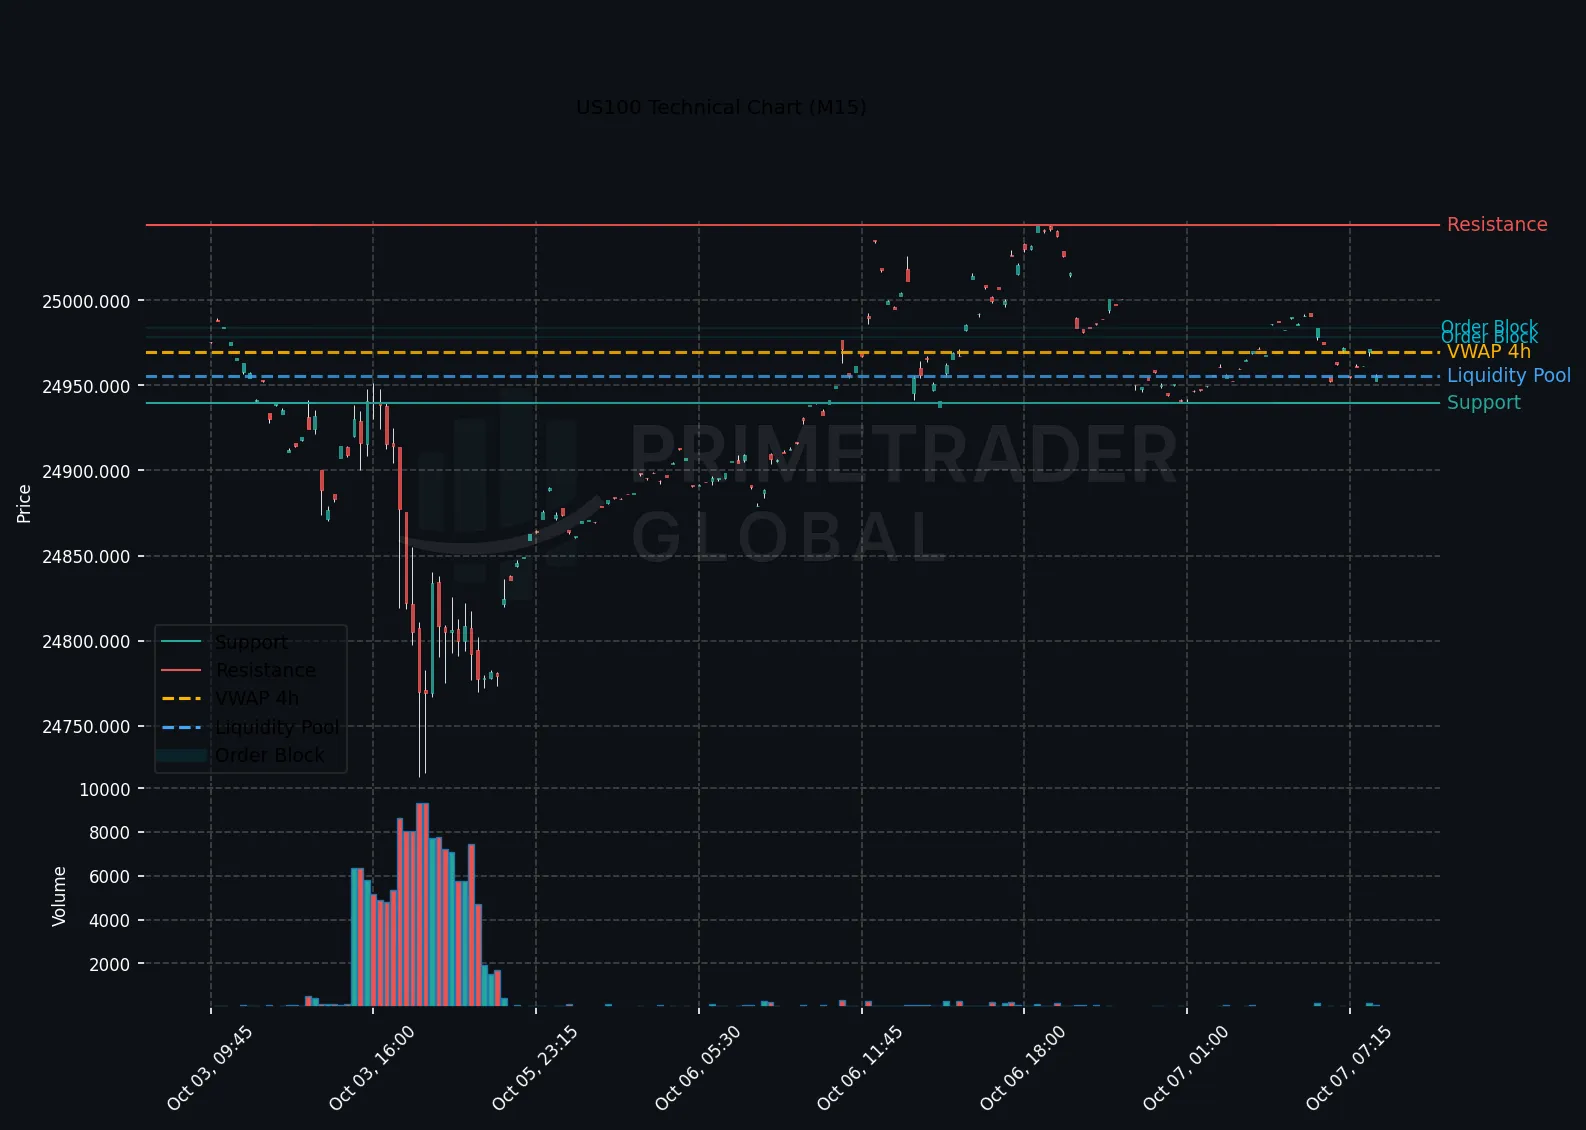
In the Europe session, the US100 has upheld a robust H1 bullish trend, underpinned by favorable alignment on the H4 timeframe. However, M15 indicators suggest a potential short-term pullback. With no significant scheduled events anticipated, the technical landscape appears undisturbed, leading to intraday flows becoming the primary market driver. Current forward probabilities indicate a slight bullish bias (44%) alongside a neutral outlook (46%), while bearish scenarios remain limited at 10%.
Macro Drivers
The prevailing macroeconomic backdrop remains neutral, as market participants await further economic signals that could provide direction. Recent economic data releases have shown mixed results, reinforcing a cautious approach among traders. This environment is conducive to an indecisive market tone, allowing for short-term technical adjustments without major macroeconomic shifts influencing sentiment.
Key Technical Anchors
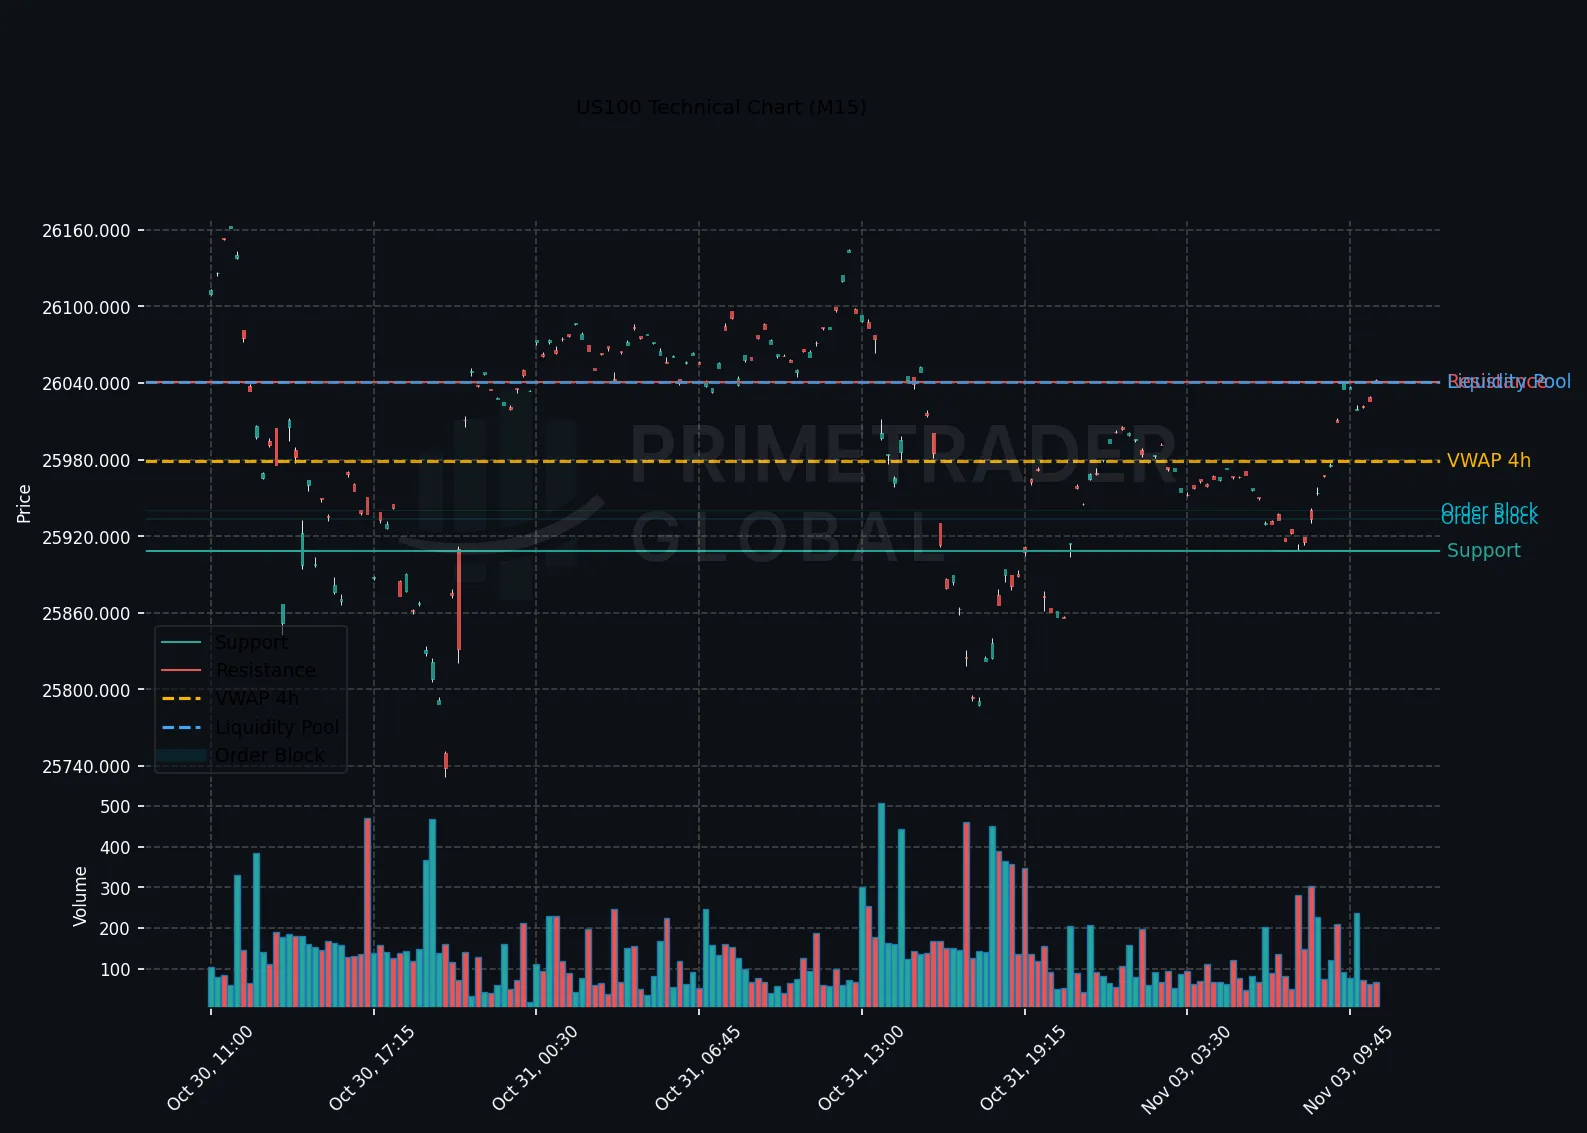
The key levels for the US100 are well defined at this juncture, with support resting at 24719.98 and resistance at 25044.0. The H1 timeframe indicates a strong uptrend, while the H4 timeframe also corroborates this bullish sentiment. The M15 timeframe raises the potential for a transient counter-move, yet overall, the technical indicators favor an upward trajectory pending a hold above key support levels.
Cross-Asset Signals
In conjunction with the US100 performance, movements in other asset classes, such as treasury yields and dollar strength, continue to play a pivotal role in shaping market conditions. The relative stability in these indicators supports the current bullish sentiment in the equity indices but highlights the need to closely monitor any shifts that may arise in correlation.
Forward Outlook
Looking ahead, the outlook for the US100 remains primarily bullish, with a focus on the critical resistance level of 25044.0. A breach here may signal a continuation of the upward trend, compelling traders to reassess their positions for increased risk-taking. Conversely, maintaining a range between 24719.98 and 25044.0 could solidify a neutral market stance in the short term. Attention to broader economic signals will be critical in shaping future probabilities.
Prime Trader Global | AI Market Intelligence | All insights derived from factual market data.