2025-10-16 18:49 UTC
Lead Overview
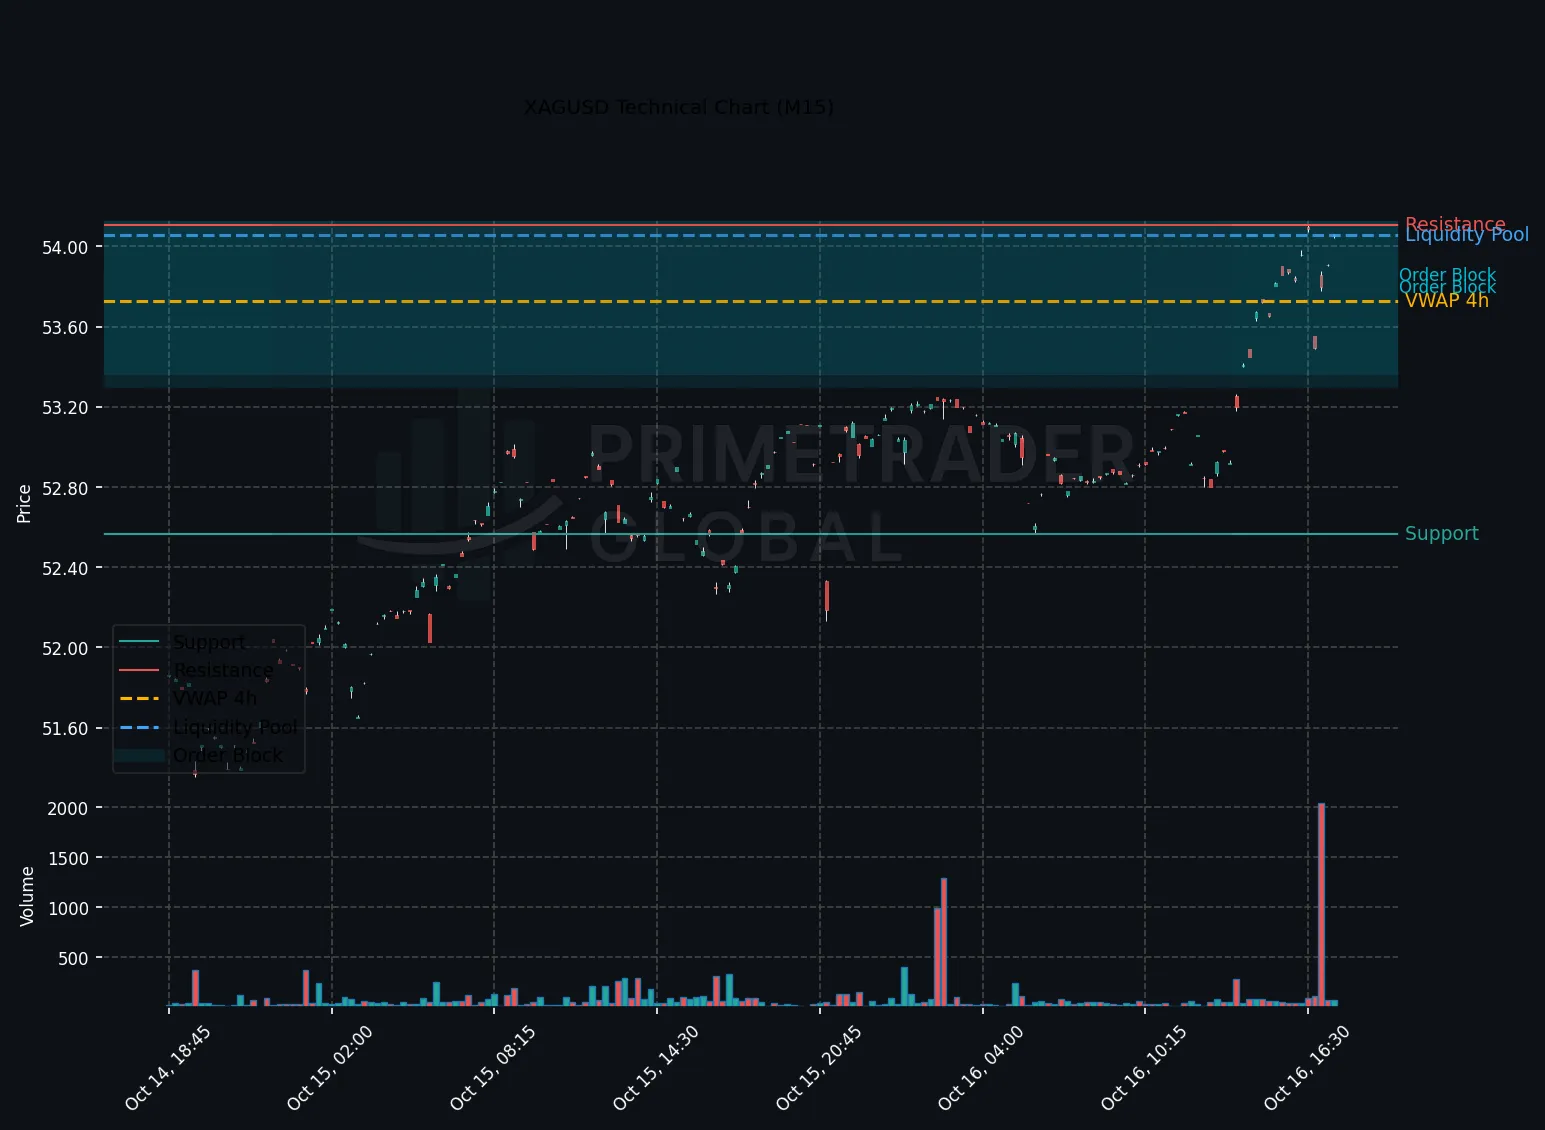
In the latest US trading session, XAGUSD’s hourly chart continues to demonstrate a persistent alignment with a strong bullish trend across all relevant timeframes. Despite this robust trend framework, market dynamics lean predominantly towards a neutral stance, with the asset likely to remain within the 52.13–53.127 range. This setup suggests a 69% probability of range-bound movement, while the chances of a breakout to the upside are limited to 13%, and a potential decline holds an 18% likelihood.
Macro Drivers
The lack of significant macroeconomic events or noteworthy topics is favoring steady price action. Emerging risk-on flows observed in the markets are supporting the broader bullish undertone but have not yet translated into substantial momentum shifts for XAGUSD, thus sustaining the neutral outlook.
Key Technical Anchors
Technical analysis highlights critical levels framing the current trading environment. Support is pegged at 52.13, providing a floor for potential downside, while resistance is established at 53.127, a key barrier that aligns with the threshold for a possible bullish breakout.
Cross-Asset Signals
Cross-asset correlations further reinforce the dominant trend bias. However, the absence of major commodities or currency divergences surfaces no direct catalysts to recalibrate the neutral outlook for XAGUSD. Traders should monitor broader risk sentiment shifts as potential indicators of directional clarity.
Forward Outlook
Given the prevailing technical and macro backdrop, XAGUSD is projected to sustain its neutral posture in the near term. The price is expected to fluctuate predominantly within the identified range of 52.13–53.127. Institutional traders scanning for breakout triggers will benefit from observing liquidity cues at these pivotal levels, with a break above 53.127 flagging a possible upside continuation scenario.
Prime Trader Global | AI Market Intelligence | All insights derived from factual market data.