2025-10-15 03:19 UTC
Lead Overview
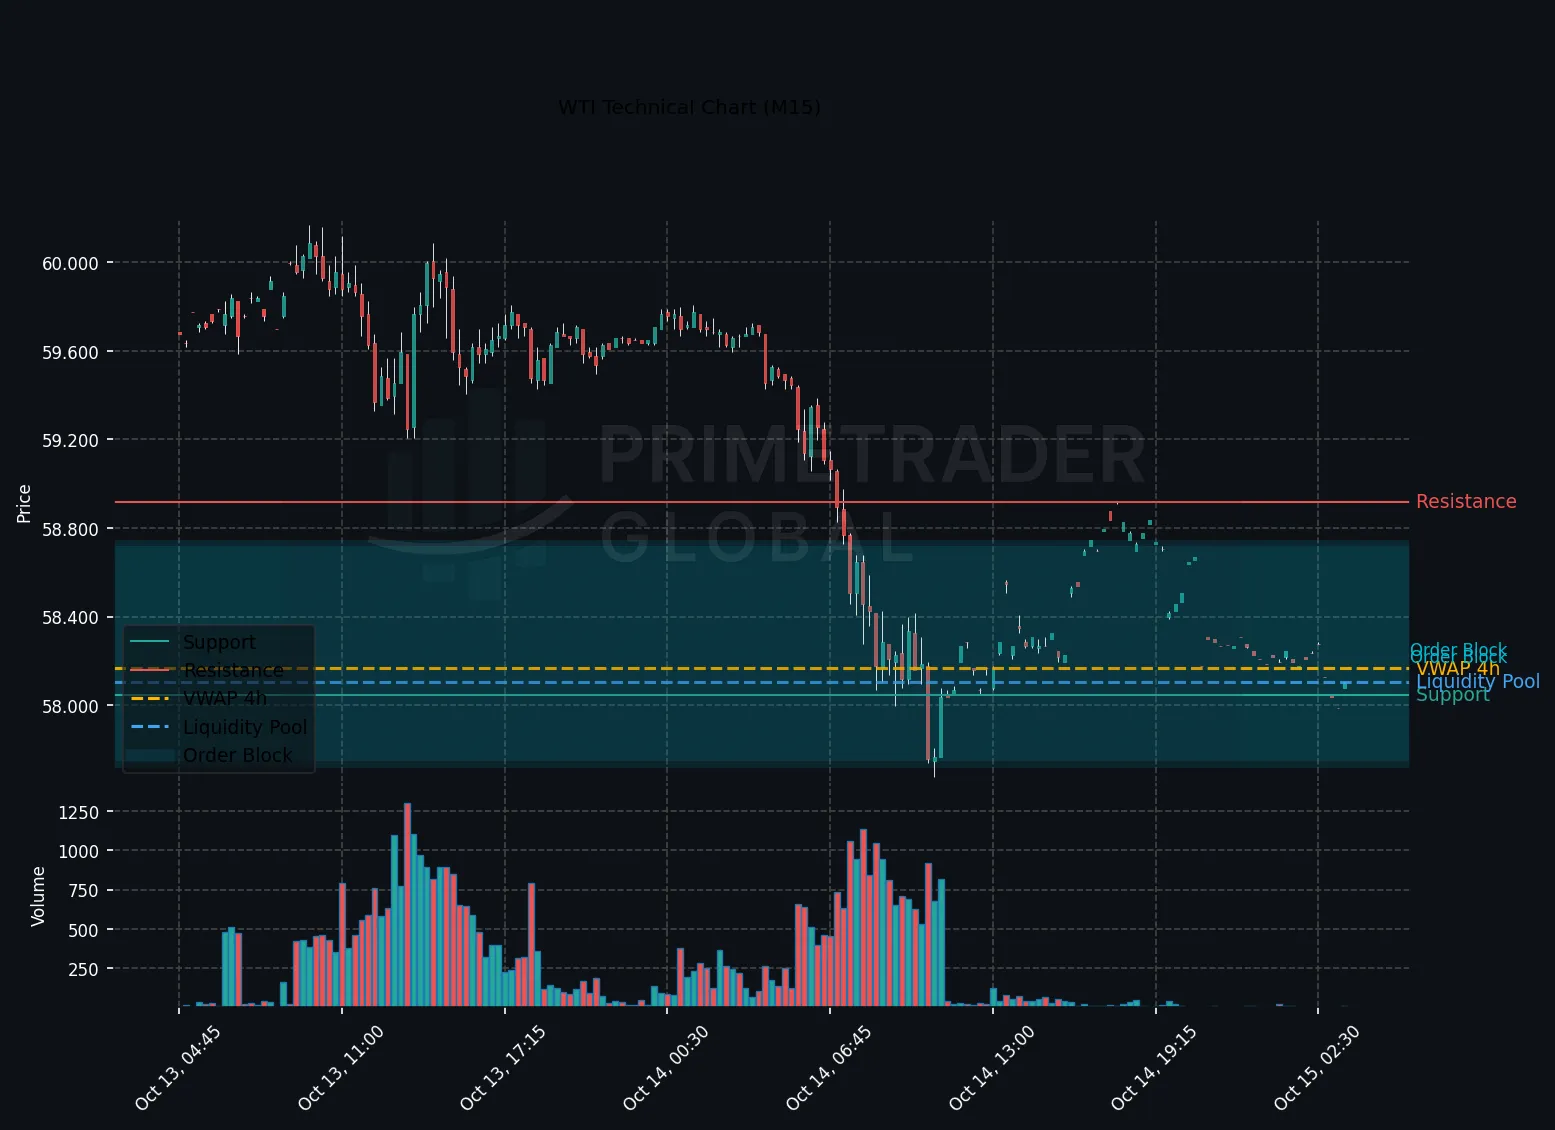
During the Asia session, WTI crude oil remains under bearish pressure across all timeframes, maintaining a strong trend consistency within a neutral macro backdrop. Without major scheduled events or market disruptions, attention rests on key technical levels and the alignment of price action. While the general outlook leans towards neutral scenarios, bearish probabilities suggest vigilance around pivotal supports and potential breakdowns.
Macro Drivers
The macro environment lacks immediate volatility catalysts, leaving WTI to trade largely on technical merits. The global oil landscape is stable, with externalities such as geopolitical concerns and supply chain dynamics providing a neutral underpinning rather than a directional force. As such, WTI’s current trajectory is primarily dictated by internal chart patterns and technical support and resistance levels.
Key Technical Anchors
WTI’s H1 chart highlights notable support at 57.677 and resistance at 61.497, critical junctions that could dictate short-term directional shifts. A breach below 57.677 could validate bearish continuations, whereas rising above 61.497 would signal a potential shift towards a bullish upside.
Cross-Asset Signals
Cross-asset indicators suggest cautious optimism in related sectors, yet the crude oil market’s insular nature in this session puts cross-market influence at a reduced capacity. Correlations with equity indices and currency fluctuations remain low-impact. However, vigilant monitoring of risk sentiment metrics can preempt shifts in cross-asset positioning.
Forward Outlook
Market participants should focus on price reactions near the defined technical boundaries. While a neutral stance remains predominant, bearishly inclined outcomes entail significant downside risks should 57.677 give way. Monitoring market depth and liquidity around these levels will be crucial to navigating the WTI landscape.
Prime Trader Global | AI Market Intelligence | All insights derived from factual market data.