2025-10-12 22:24 UTC
Lead Overview
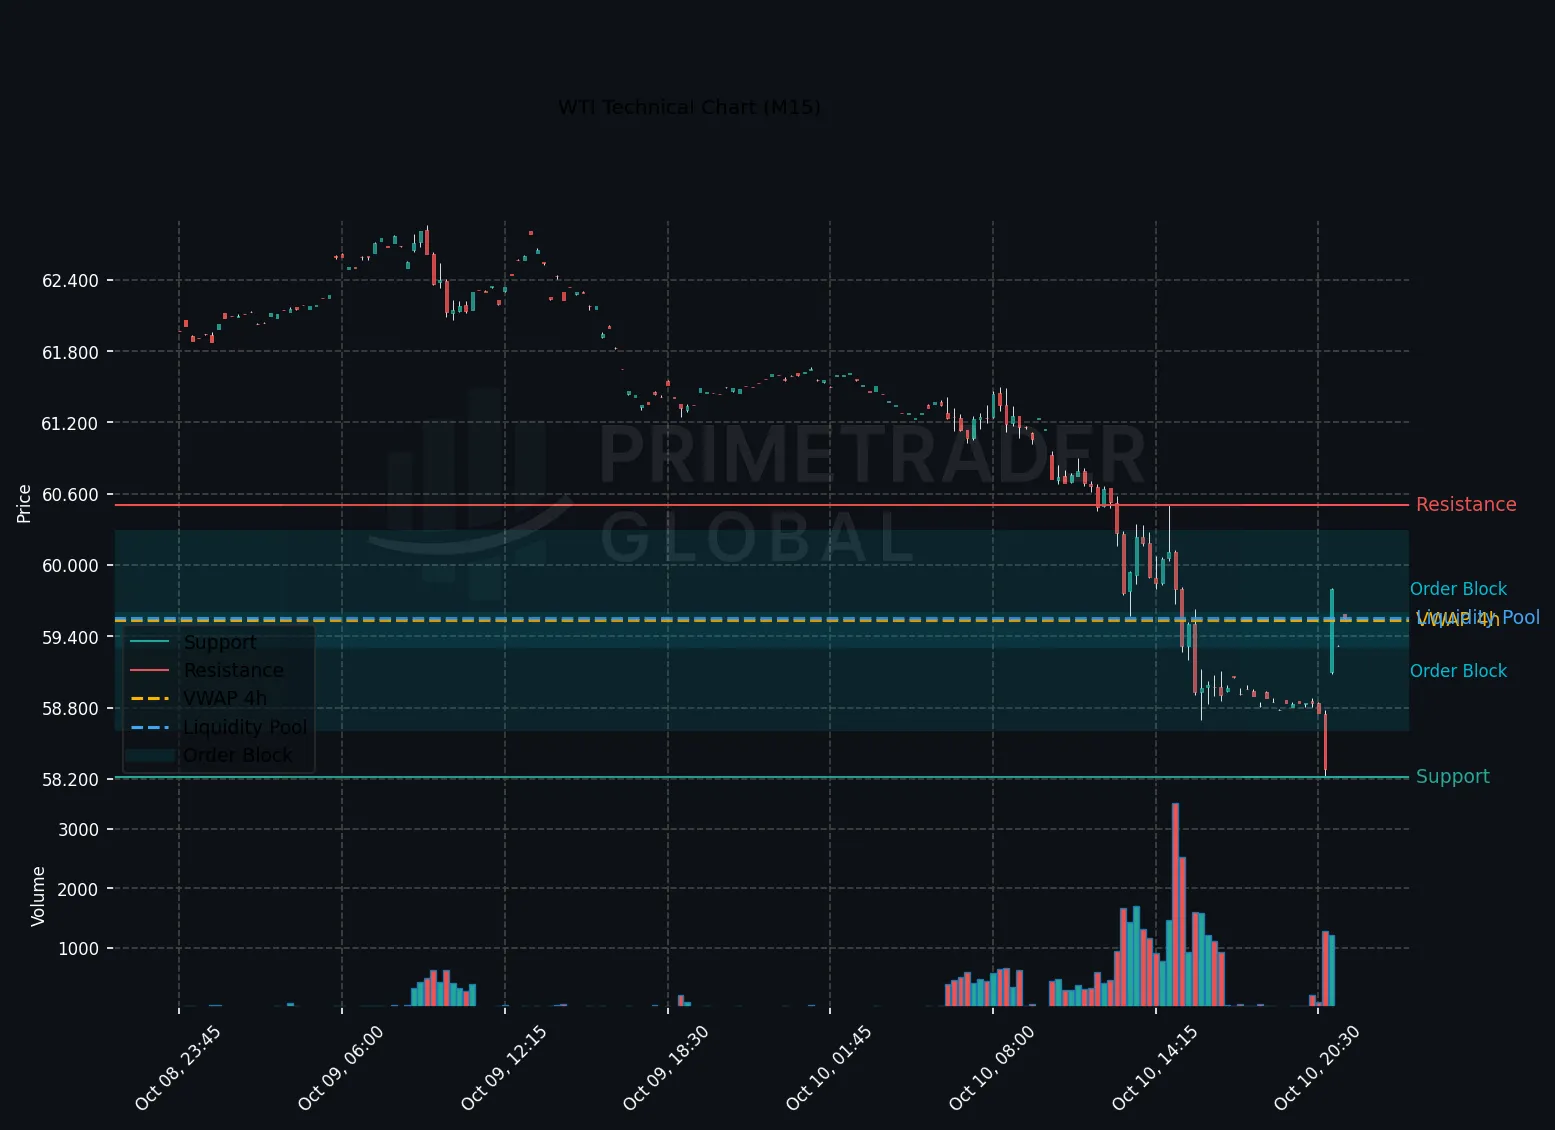
Amid a US session characterized by an emergent risk-on sentiment, West Texas Intermediate (WTI) crude oil prolonged its downward movement, maintaining a firm bearish trend across multiple timeframes. The absence of significant market events further solidifies the neutral-to-bearish outlook, with probabilities favoring continued downside pressure.
Macro Drivers
The risk-on macro backdrop has pressured crude oil prices, as investors pivot towards assets with a higher risk profile. This shift comes despite the lack of catalysts that could underpin crude oil demand in the near term. The macro sentiment aligns with recent momentum indicators, reinforcing a strong bearish disposition in the market.
Key Technical Anchors
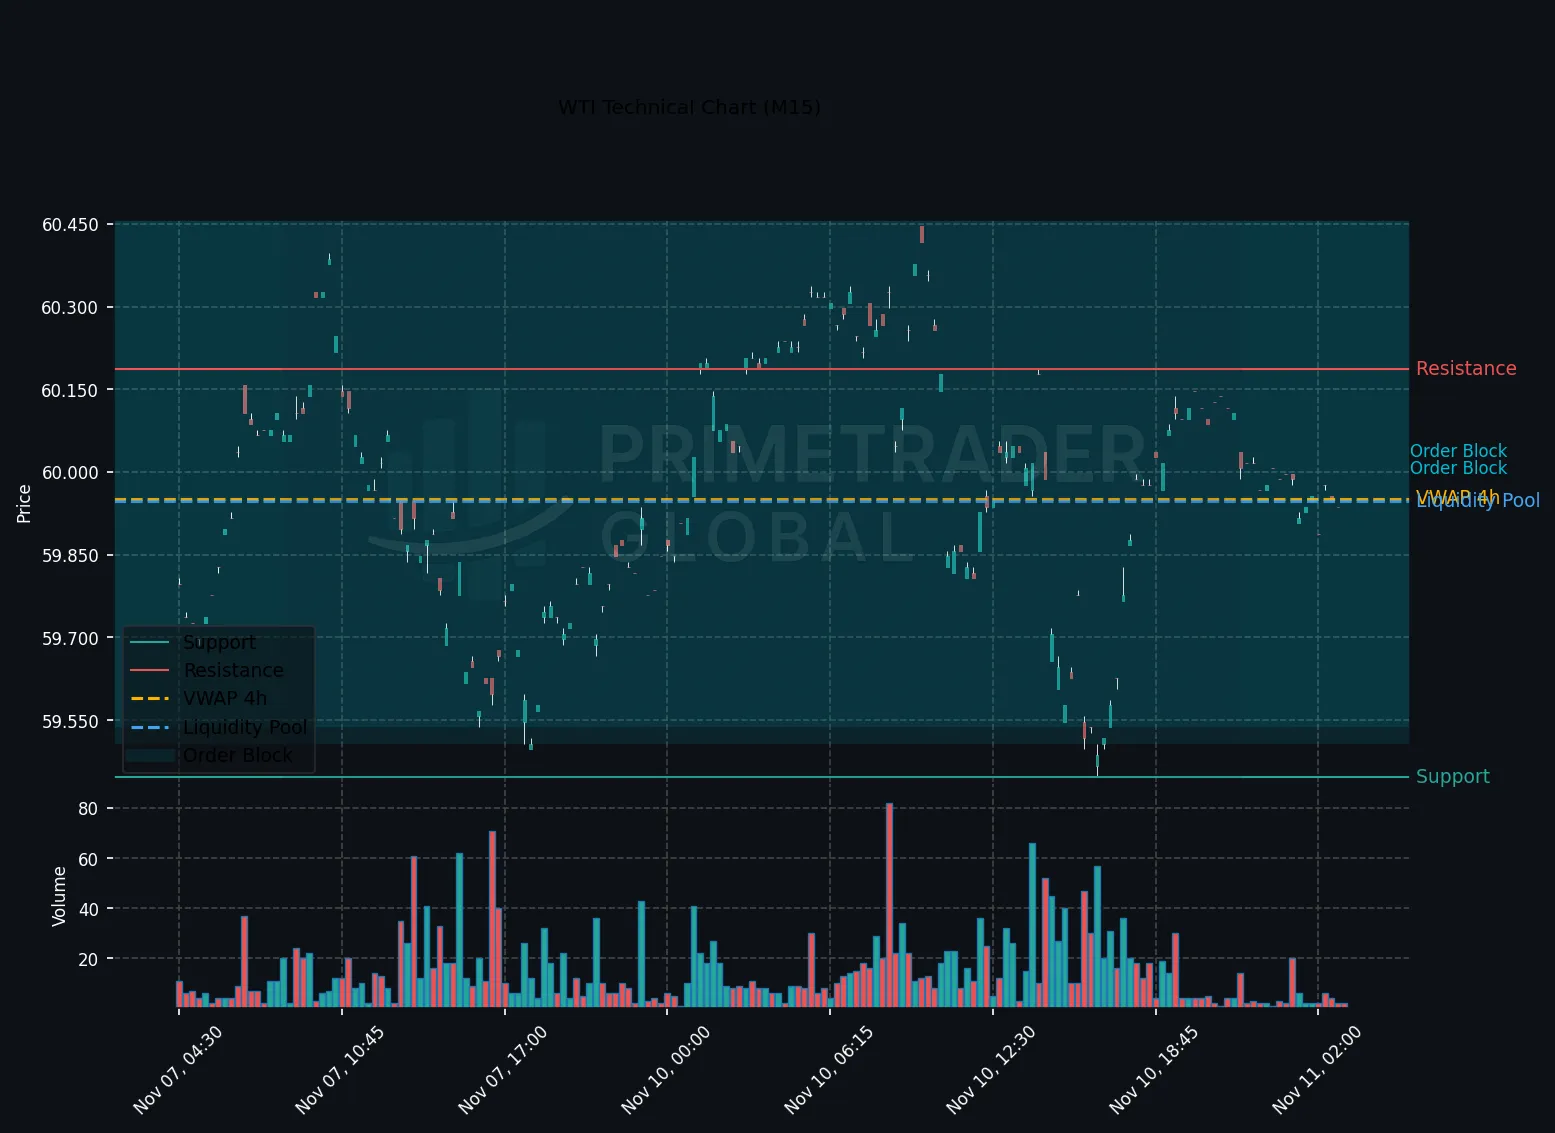
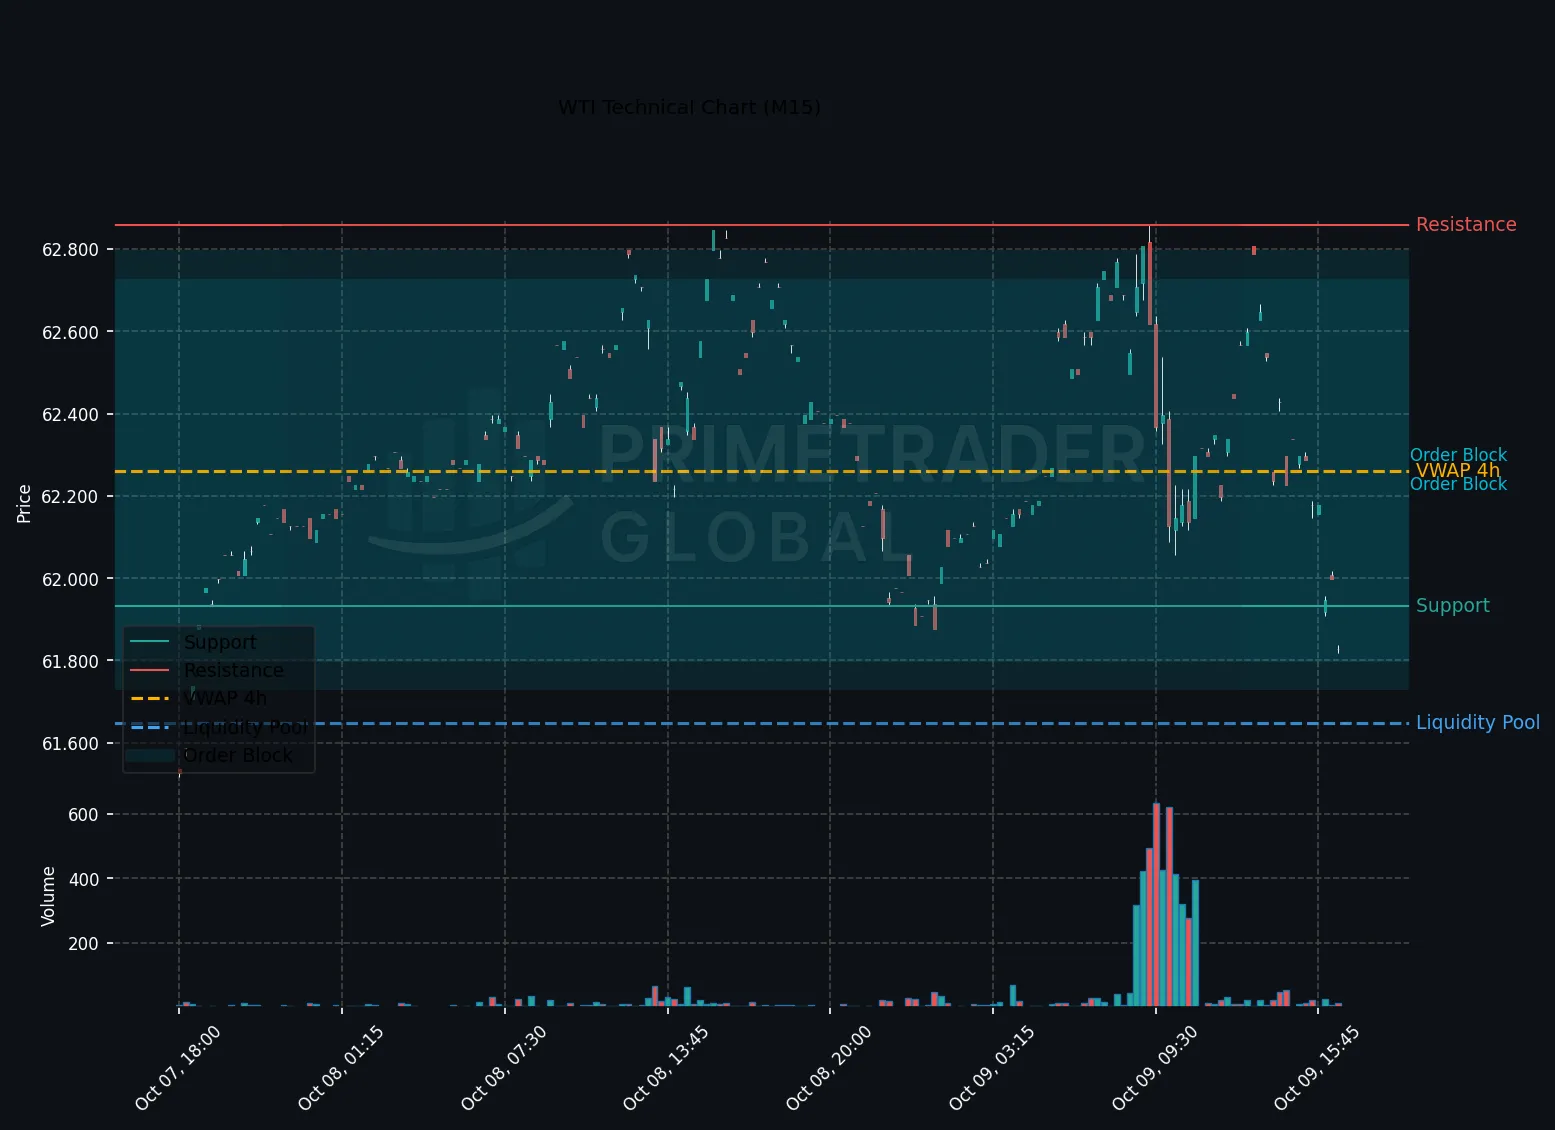
Technical analysis across various timeframes converges on a bearish strong bias, consistently indicating a continuation of the current trend. For WTI on the H1 chart, critical levels to monitor include support at 58.697 and resistance at 62.847. The trend strength suggests that any break below the support level could trigger an acceleration of losses.
Cross-Asset Signals
Correlations with other risk assets underscore a broader market movement towards risk-on positioning, diminishing demand for commodity hedges like crude oil. With equities gaining traction, funds are reallocating from defensive holdings, further pressuring WTI prices.
Forward Outlook
Market sentiment towards WTI remains predominantly bearish in the short to medium term. While a potential bullish scenario exists with a break above 62.847, the probability is limited at 14%. Instead, the market is more likely to consolidate within a neutral range between 58.697 and 62.847, or extend losses if the bearish trend deepens below support. This aligns with the dominant risk-on narrative impacting crude oil market dynamics.
Prime Trader Global | AI Market Intelligence | All insights derived from factual market data.