2025-11-19 05:23 UTC
Lead Overview
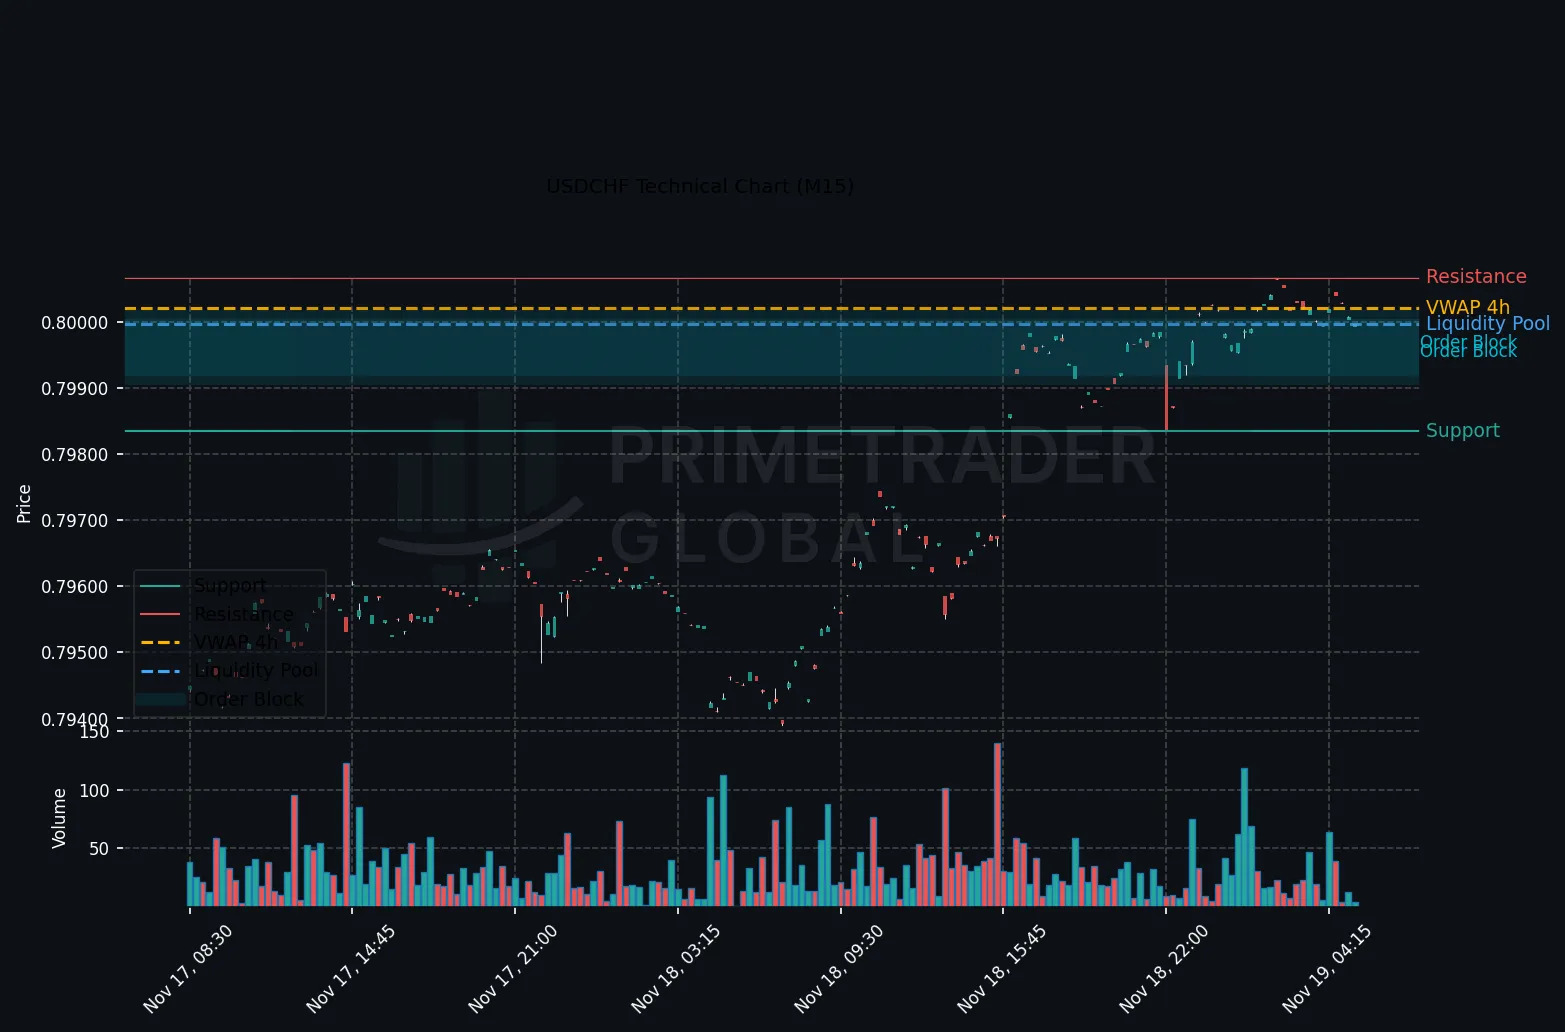
In early Asian trading, USDCHF is sustaining its bullish posture on the H1 timeframe, amid a broader risk-off sentiment that has impacted neighboring currencies such as AUD and NZD. With the FOMC Meeting Minutes catalyst approaching, market participants are positioning within a framework of 27% bullish, 59% neutral, and 14% bearish probabilities, reflecting a cautious but firm stance on the H1 chart.
Macro Drivers
The prevailing risk-off sentiment across Asia-Pacific markets is exerting downward pressure on higher-beta currencies, yet USDCHF remains buoyant. This dynamic suggests investors are looking towards the upcoming FOMC Meeting Minutes for clearer policy directions that may influence USD trajectories across global markets.
Key Technical Anchors
On the H1 chart, USDCHF faces resistance at 0.80043, with a potential breakout indicating an upside continuation. Conversely, significant support is identified at 0.79424, where a breach may signal entrenched bearish pressures. Short-term bullish strength is observed in contrast to medium-term bearish tendencies.
Cross-Asset Signals
AUD and NZD depreciation aligns with wider risk aversion tendencies, underscoring investors’ cautious stances. USDCHF’s relative strength amid this backdrop is indicative of a search for safe-haven stability, as cross-asset correlations point towards guarded optimism pending FOMC disclosures.
Forward Outlook
Maintaining its position within the 0.79424 – 0.80043 range, USDCHF could see amplified activity around the 0.80043 resistance, aligned with a 27% bullish outlook. Market participants remain prepared for potential volatility shifts, contingent on FOMC commentary, with a neutral range scenario still predominating at 59%. A decisive directional shift may emerge post-event, aligning with broader macroeconomic signals.
Prime Trader Global | AI Market Intelligence | All insights derived from factual market data.