Lead Overview
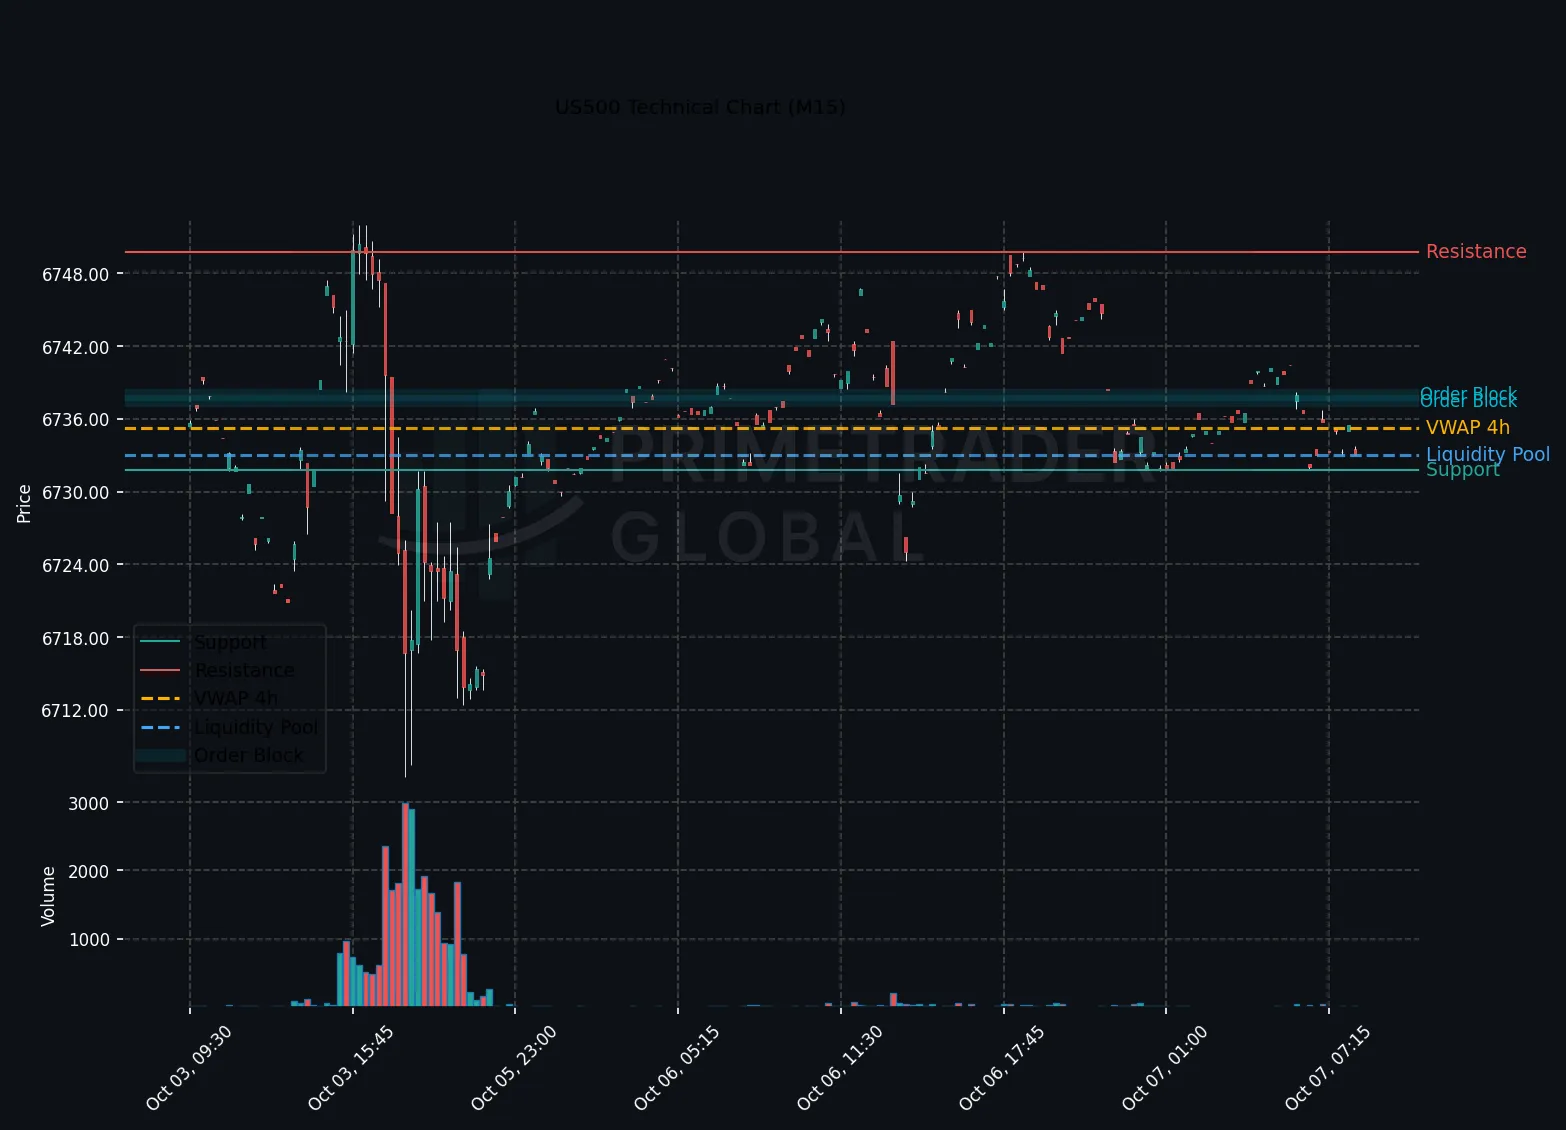
During the Europe session, the US500 maintained a firm H1 uptrend, underpinned by a bullish correlation on both H4 and H1 timeframes. The intraday M15 timeframe indicates the potential for a short-term counter-move. With no major market-moving events on the calendar, the macro bias remains Neutral, suggesting traders should focus on potential continuation (34% bullish) or consolidation (53% neutral), with a lesser probability of a bearish pivot (12%) that could disrupt the existing multi-timeframe alignment.
Macro Drivers
The current macro landscape is characterized by a lack of impactful economic data, which constrains aggressive market movements. As of now, investors are cautiously monitoring geopolitical developments and signs of economic resilience, which might emerge in upcoming reports. This context supports a Neutral bias while offering a structured framework for evaluating potential price action within established ranges.
Key Technical Anchors
The US500 exhibits notable technical integrity, with crucial support situated at 6706.47 and resistance firmly placed at 6751.97. These levels serve as critical anchors for traders, with the ability to dictate market sentiment in the near term. The prevailing bullish setup suggests that a breach above the resistance could facilitate upside potential, while holding above support preserves the current uptrend.
Cross-Asset Signals
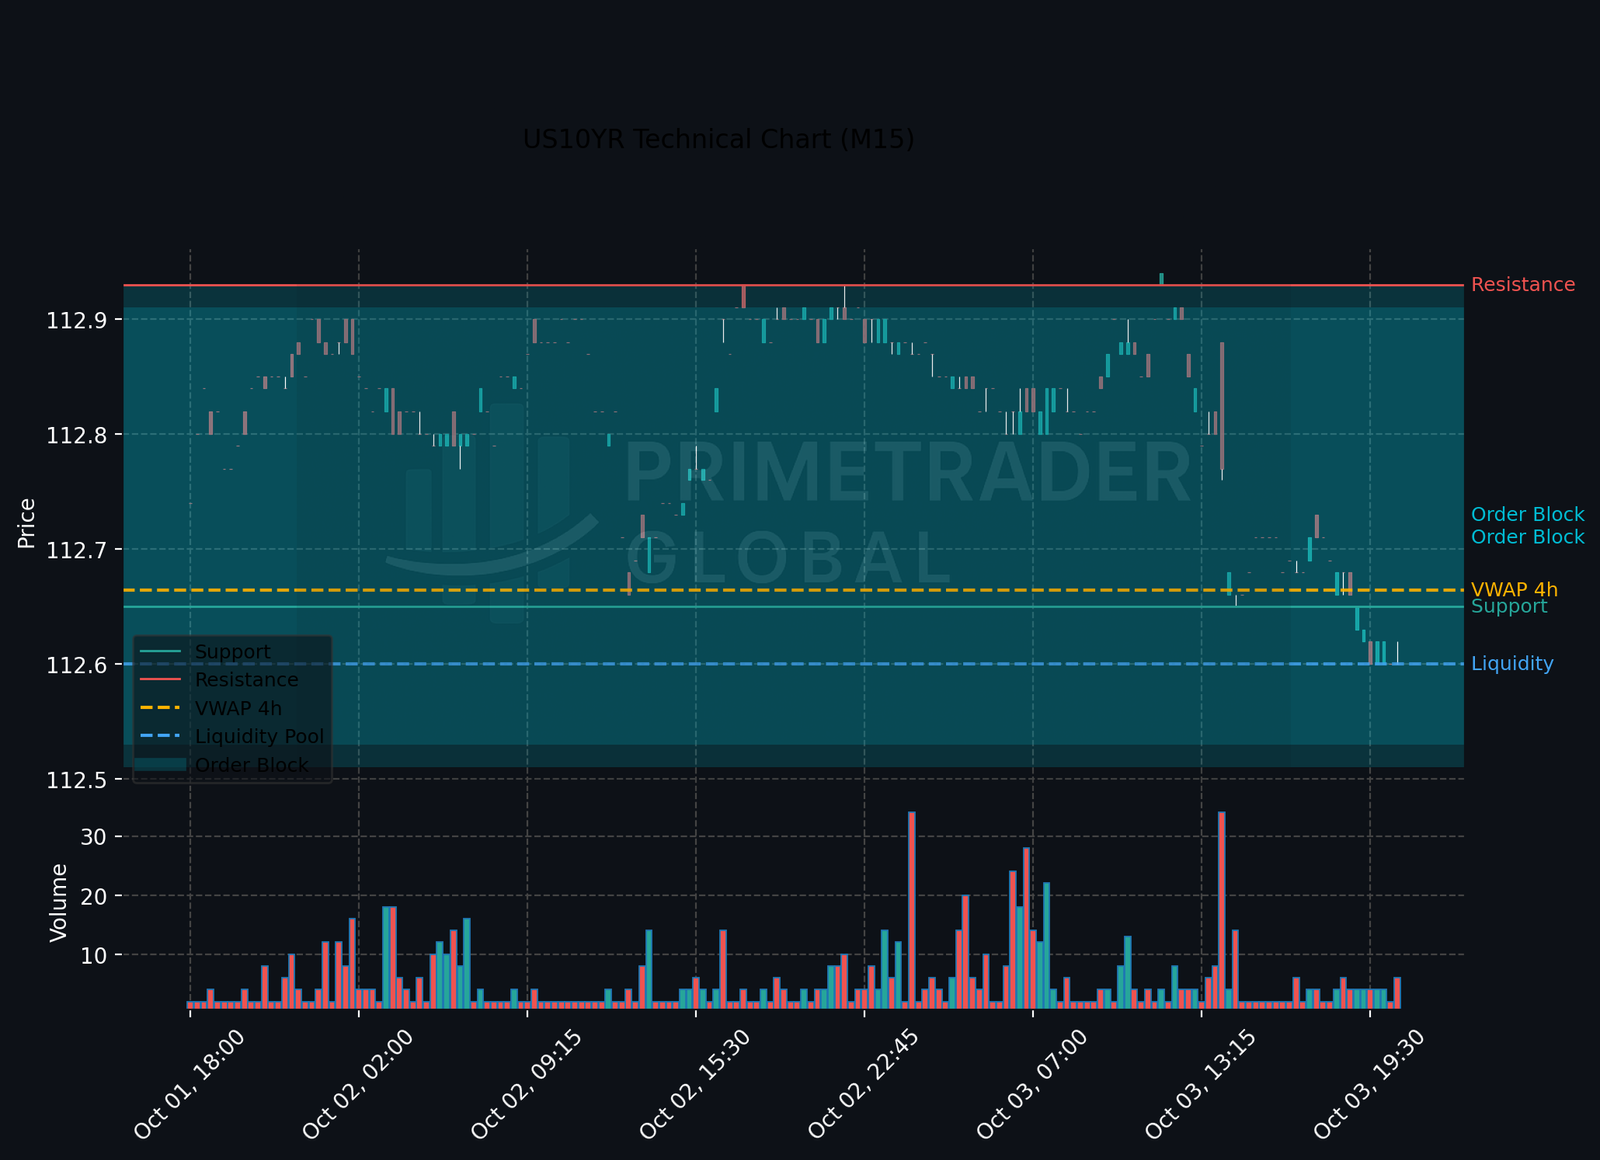
In terms of cross-asset dynamics, equities generally display resilience correlating with stable bond markets and moderate shifts in the currency landscape. However, any volatility in related asset classes, particularly in yields and the dollar, may introduce external pressures that could alter the trajectory of the US500. As a result, ongoing vigilance across asset correlations remains essential.
Forward Outlook
Looking ahead, traders should brace for potential scenarios encompassing: Bullish (34%) outlook facilitated by a break above 6751.97, Neutral (53%) conditions likely resulting in a range play between 6706.47 and 6751.97, and a Bearish (12%) outcome should prices drop below 6706.47, which would signal extended losses. The interplay of these factors will be central to navigating future market developments.
Prime Trader Global | AI Market Intelligence | All insights derived from factual market data.