2025-11-12 16:17 UTC
Lead Overview
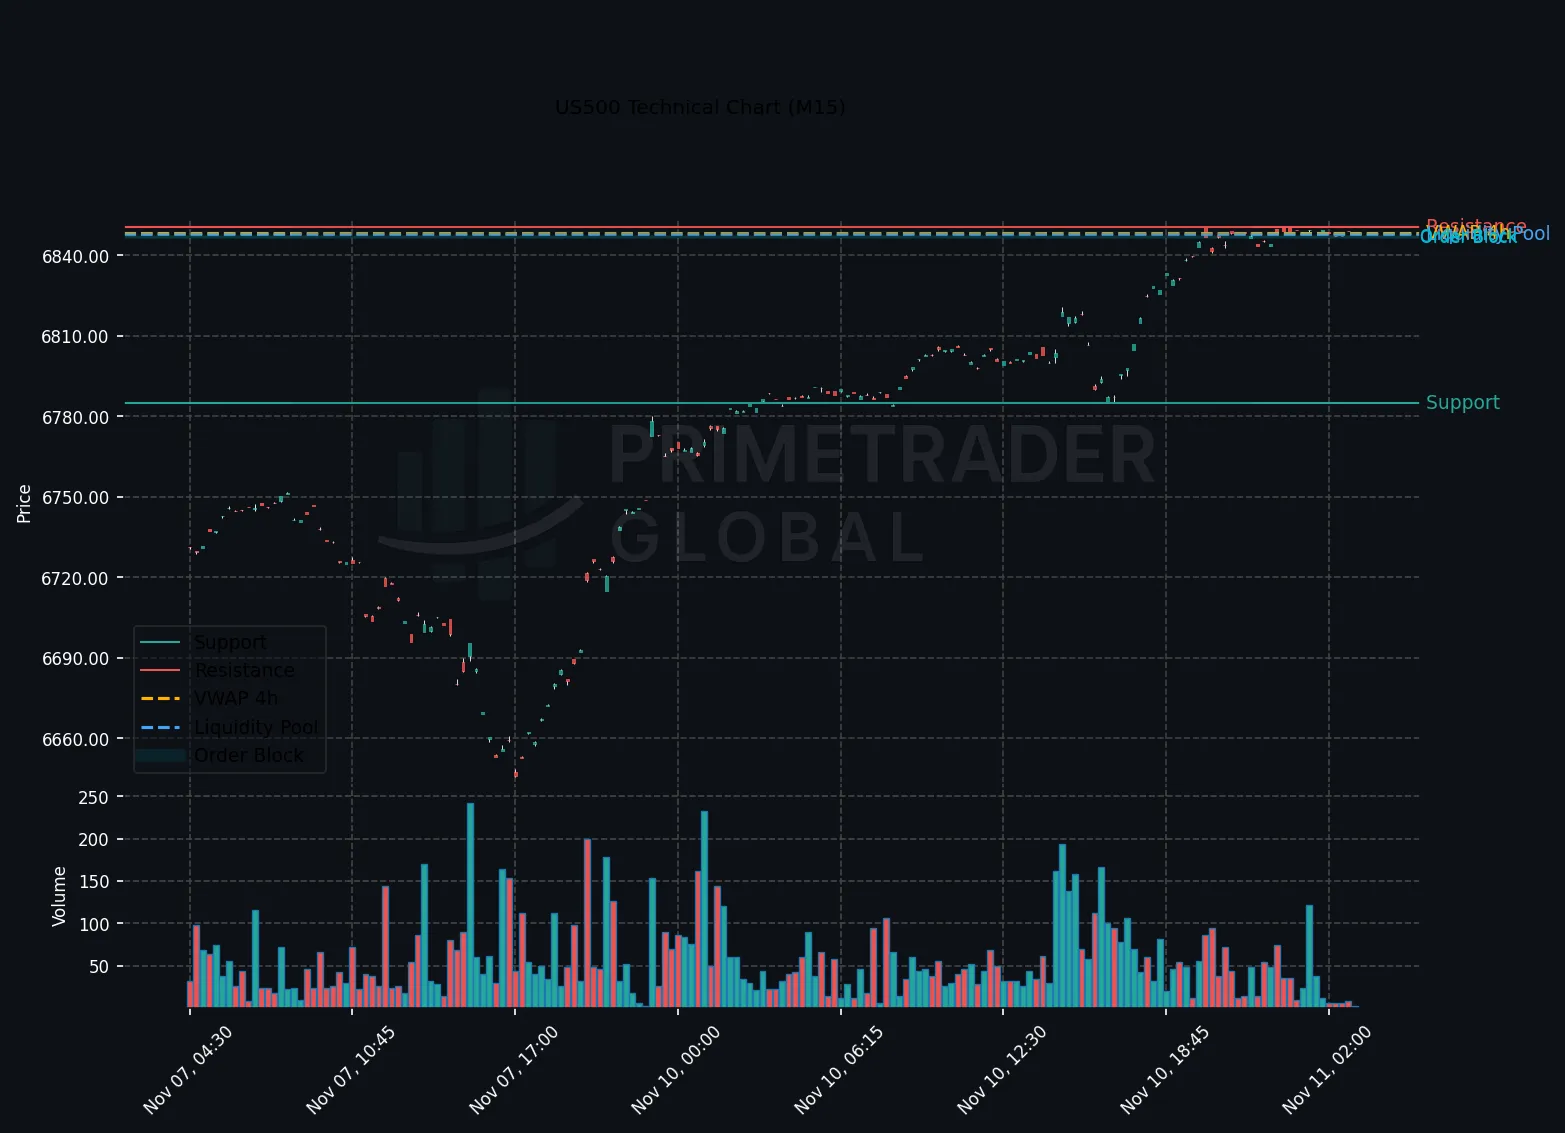
The US500 index maintained its upward momentum during the US session, with short-term charts reflecting a bullish stance despite a prevailing risk-off sentiment in the macro environment. This outlook is supported by Deutsche Bank’s projection of S&P 500 reaching 7000 by the end of 2025. The divergence between short-term bullish signals and the broader bearish trend is indicative of a complex market dynamic, with probabilities favoring bullish scenarios at 69%.
Macro Drivers
The absence of significant economic events today allowed market participants to focus on corporate forecasts and technical patterns. The prevailing risk-off sentiment typically pressures equities, yet the US500 exhibits resilience, partially inspired by upbeat long-term projections, such as Deutsche Bank’s ambitious year-end target for the S&P 500.
Key Technical Anchors
Technically, the US500 remains bullish in the short-term, with key resistance at 6849.88. A break above this level could catalyze further buying interest. Conversely, support is located at 6645.5, a critical level for maintaining the short-term bullish outlook.
Cross-Asset Signals
Despite the risk-off tone generally benefitting fixed-income assets and safe havens, the equity market’s current buoyancy suggests underlying strength or speculative optimism. Cross-asset performance indicators remain mixed, with traditional correlations to risk-on and risk-off sentiment showing less conventional alignments.
Forward Outlook
Market positioning implies a predominance of bullish scenarios, with a 69% probability supporting further advances beyond 6849.88. Neutral tones emerge at 26% with expectations of a trading range between 6645.5 and 6849.88, while bearish potential remains low at 5%, contingent on a breach below 6645.5. Overall, the US500’s short-term outlook remains favorable, buoyed by macroeconomic resilience and positive equity forecasts.
Prime Trader Global | AI Market Intelligence | All insights derived from factual market data.