2025-11-06 02:41 UTC
Lead Overview
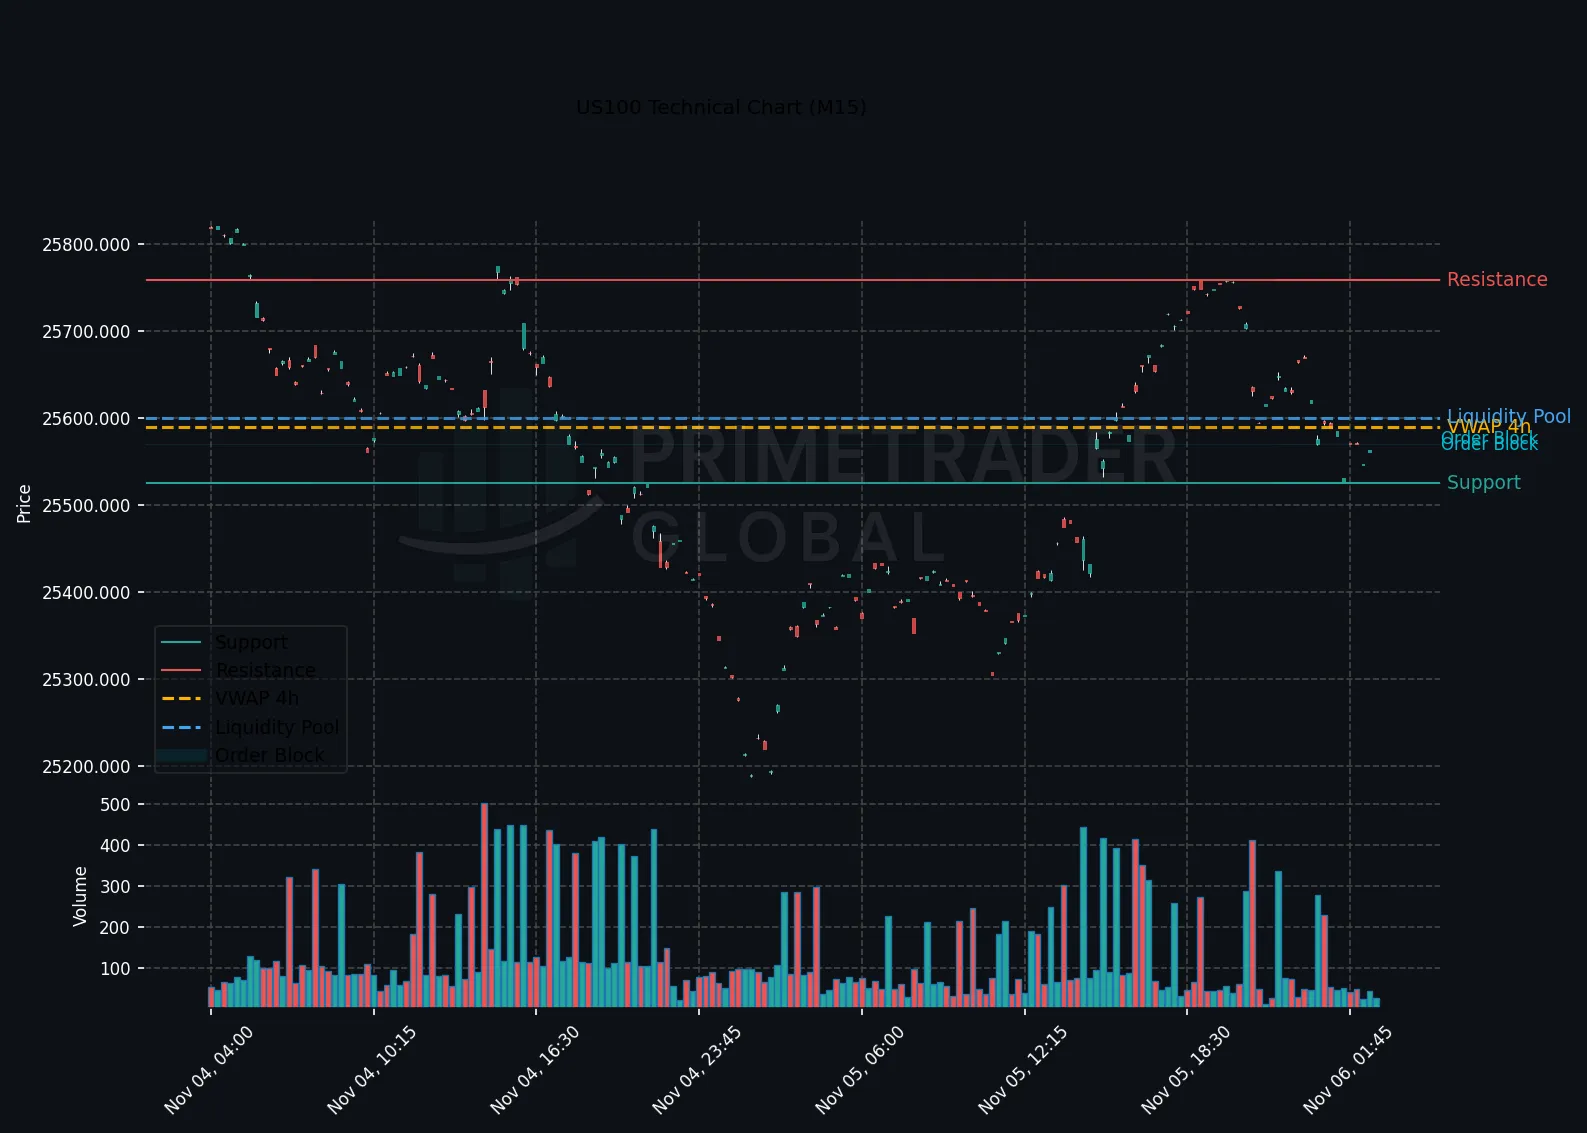
The US100 index is exhibiting a pronounced bearish inclination during the Asia session, as observed on the H1 chart. A convergence of macroeconomic factors, including the reaction to the recent ISM Services PMI and the anticipation of remarks from FOMC member Waller, is intensifying downside sentiment. Additionally, tech sector volatility, highlighted by AMD’s recent performance, further augments this bearish scenario.
Macro Drivers
The ISM Services PMI released over the last 12 hours indicated softer economic conditions, prompting a reevaluation of risk across tech-heavy indices. Market participants are also keenly awaiting commentary from FOMC member Waller, which could provide further insights into the Federal Reserve’s policy trajectory, thereby influencing risk appetite.
Key Technical Anchors
In the immediate term, the H1 chart reveals crucial technical thresholds. Support is firmly positioned at 25231.21, while resistance is identified at 25775.29. Despite a brief counter-move signal on the M15 timeframe, the overarching H4 and H1 trends remain strongly bearish.
Cross-Asset Signals
The broader cross-asset landscape supports a cautious approach. With ISM Services PMI resonating through bond yields and dollar dynamics, there is an evident spillover effect, reinforcing bearish pressures on equity indices. Furthermore, the tech sector’s sensitivity, particularly with regard to AMD’s recent test, contributes to the prevailing narrative of increased volatility.
Forward Outlook
The forward-looking scenario analysis suggests an 82% probability of bearish continuation if levels fall below 25231.21, emphasizing the potential for extended losses. A bullish reversal remains unlikely unless the US100 surpasses 25775.29 decisively. The upcoming FOMC member Waller speech serves as a pivotal event that could reshape short-term positioning.
Prime Trader Global | AI Market Intelligence | All insights derived from factual market data.