2025-11-07 04:15 UTC
Lead Overview
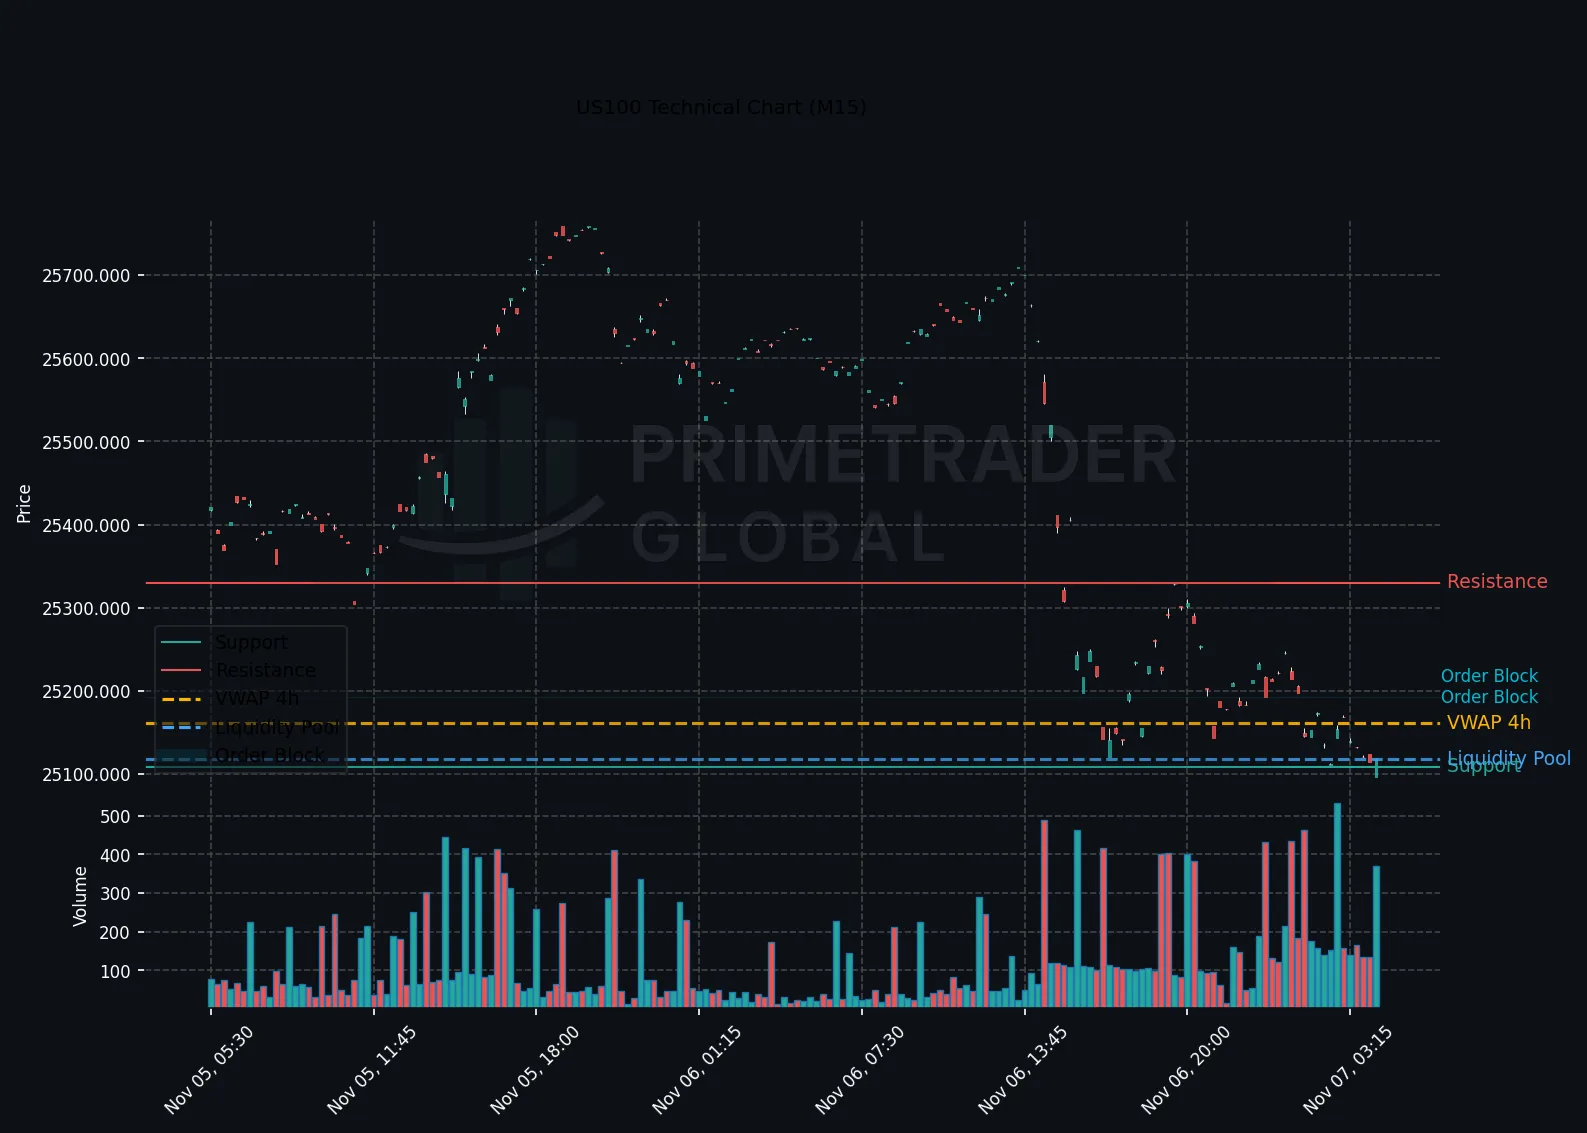
The US100 index has solidified its downside momentum during the Asian trading session, with a strong bearish trend evident across all timeframes. This comes as market participants anticipate the release of the Preliminary University of Michigan (UoM) Inflation Expectations, which could potentially introduce further volatility. However, the prevailing macro sentiment remains neutral, with a strong inclination towards continued bearish behavior.
Macro Drivers
The primary macroeconomic focus is on the upcoming UoM Inflation Expectations data. Market analysts are poised to gauge any shifts that this measurement of consumer sentiment could induce in inflation-related forecasts, which may, in turn, affect US100 positions. Current forward probabilities suggest limited bullish potential (14%), maintaining neutrality as the primary stance (47%), with a significant lean towards bearish prospects (39%).
Key Technical Anchors
The US100 is navigating within a critical technical range, bounded by support at 25119.74 and resistance at 25678.27. A break below the lower bound may accentuate the existing bearish trend, while surpassing the resistance could hint at a bullish push, though probabilities suggest this is less likely.
Cross-Asset Signals
Cross-asset dynamics remain synchronized with the overall bearish alignment in equities, as risk-off sentiment persists amid the current macroeconomic environment. Any deviations in UoM data could affect multiple asset classes, triggering recalibrations in volatility and liquidity across major indices and sectors.
Forward Outlook
The forward outlook remains skewed towards bearish developments, with emphasis on a potential decline beyond the 25119.74 support level, thus amplifying downside risks. A neutral range is the more probable scenario between 25119.74 and 25678.27, aligned with current market sentiments. Traders are advised to monitor macroeconomic cues closely as they could alter the trajectory of existing trends.
Prime Trader Global | AI Market Intelligence | All insights derived from factual market data.