2025-10-16 18:55 UTC
Lead Overview
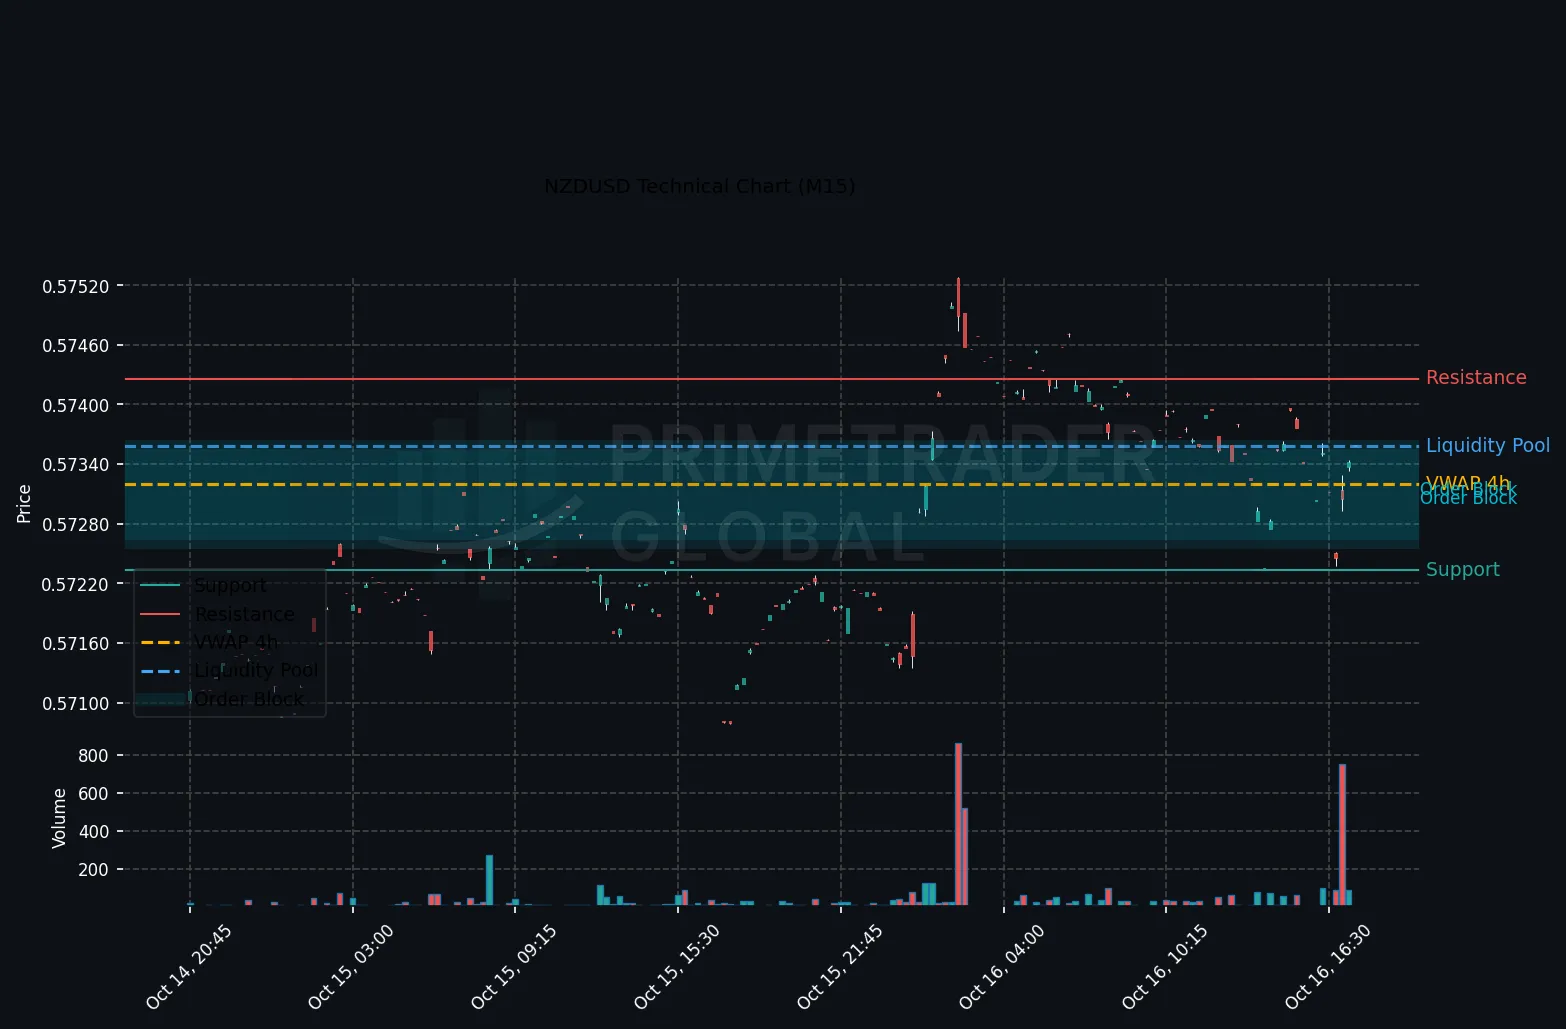
In the latest US session, the NZD/USD has shown a range-bound pattern, indicative of a neutral market stance. Despite some upward attempts, the currency pair is constrained largely by selling pressure in U.S. equity markets, particularly the S&P 500, which has declined approximately 1%. This has resulted in a mixed multi-timeframe alignment, suggesting that traders are maintaining a cautious outlook.
Macro Drivers
Current macro drivers highlight a divergence between forex and equity market sentiments. The NZD/USD’s inability to break out of its range can be attributed to global risk factors, with U.S. equities exhibiting notable vulnerability. This risk-off tone in equity markets creates downward pressure on the NZD, curbing any potential bullish momentum in the currency pair.
Key Technical Anchors
On the H1 chart, the NZD/USD support level is identified at 0.57119, reflecting a likely floor for downward movements unless breached. Conversely, resistance is established at 0.57503, acting as a ceiling that needs to be overcome for any bullish continuation. These anchors are crucial for institutional traders monitoring range boundaries and breakout potentials.
Cross-Asset Signals
The weakness in U.S. equities is sending ripple effects across forex markets. The S&P 500’s downturn compels investors to reconsider risk assets, potentially leading to shifts in currency pair dynamics. As a result, NZD/USD traders should observe equity market trends closely, as any further declines could reinforce the current neutral trading environment.
Forward Outlook
Looking ahead, a neutral trading range between 0.57119 and 0.57503 remains likely, unless significant macroeconomic data or market volatility disrupts the status quo. Should the pair break above 0.57503, it could signal a bullish continuation, whereas a drop below 0.57119 might extend losses, warranting re-evaluation of trading strategies amid potential bearish pressures.
Prime Trader Global | AI Market Intelligence | All insights derived from factual market data.