2025-10-09 07:32 UTC
Lead Overview
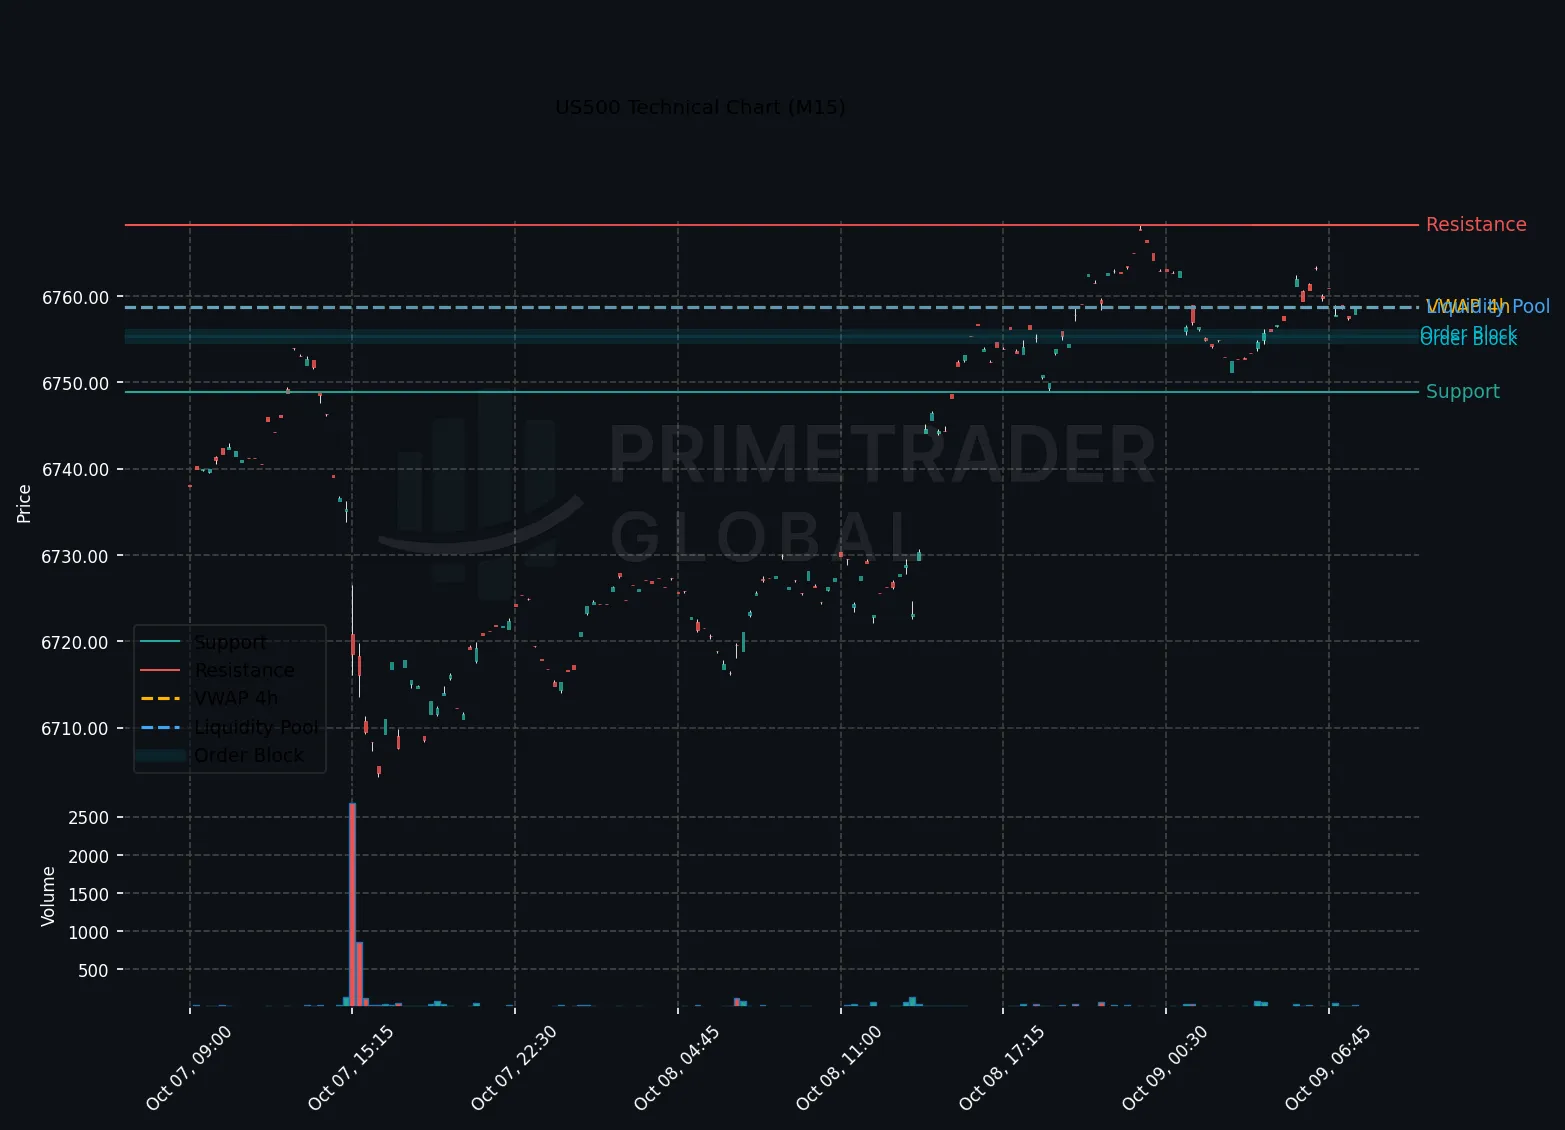
The US500 index is exhibiting bullish momentum in the H1 timeframe during the Asia session. This movement is reinforced by a supportive H4 alignment, while the M15 analysis alludes to a potential short-term counter-move. The anticipation surrounding Fed Chair Powell’s upcoming speech is keeping the macro bias neutral, as fiscal policies related to social concerns like dementia care remain on traders’ radars.
Macro Drivers
Anticipation of Fed Chair Powell’s remarks on prevailing economic conditions is a key driver in today’s session. Traders are cautious as they assess the influence of potential fiscal policies, which could affect consumer sentiment. These factors currently weigh on macroeconomic positioning, sustaining a neutral bias until clearer directives emerge post-speech.
Key Technical Anchors
The US500’s technical setup reveals crucial thresholds at 6707.31 as support and 6764.94 as resistance. A breakthrough above this resistance could reinforce the H1 bullish narrative, potentially leading to further upside continuation. Conversely, falling below the support level may exacerbate downside risks.
Cross-Asset Signals
Cross-asset signals remain mixed, with equity market sentiment potentially swayed by broader economic commentary later in the day. While bond yields and currency pairs remain relatively stable, any insights provided by Powell might necessitate quick recalibrations of institutional portfolios.
Forward Outlook
Looking ahead, the probability of a bullish scenario unfolding remains significant, especially if US500 breaches the key resistance level of 6764.94. However, caution should be exercised until Powell delivers his speech, as his commentary could redefine current market dynamics. As such, the neutral outlook retains prominence, suggesting a likely consolidation phase between the identified support and resistance levels.
Prime Trader Global | AI Market Intelligence | All insights derived from factual market data.