2025-11-12 16:13 UTC
Lead Overview
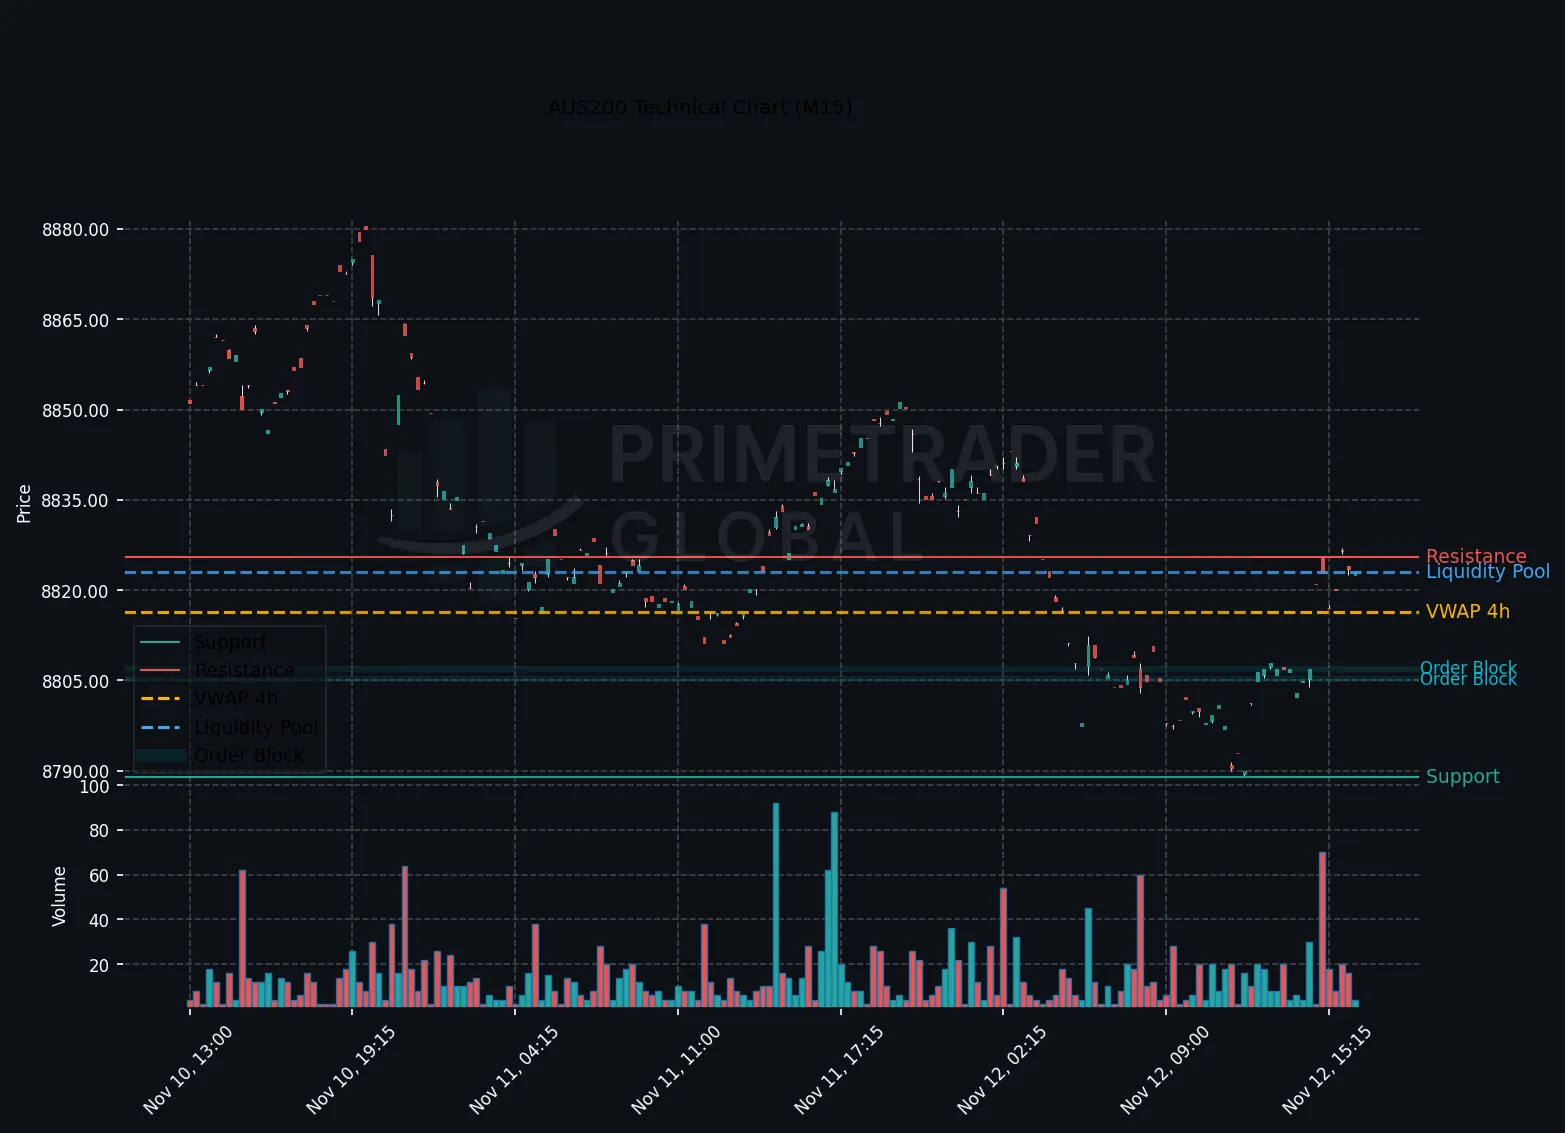
In the US session, the AUS200 index is experiencing a downturn, aligned with a pronounced bearish momentum evident on the H1 charts. The market’s focus is on the imminent release of unemployment data, which could either exacerbate this downward trajectory or catalyze a short-lived relief rally. Notably, Deutsche Bank’s forecast of the S&P 500 reaching 7000 has also captured interest, potentially influencing market sentiment.
Macro Drivers
The overarching macroeconomic catalyst remains the anticipated unemployment figures. A higher-than-expected unemployment rate could amplify risk aversion, pressuring the AUS200 further. Conversely, a favorable jobs report might offer temporary support for risk assets, aided by positive sentiment from Deutsche Bank’s S&P 500 projection.
Key Technical Anchors
The current support level is positioned at 8788.97, with resistance at 8875.73. While H4 and H1 trends remain strongly bearish, a potential short-term counter-move on the M15 chart presents a tactical juncture for positioning against the prevailing trend.
Cross-Asset Signals
Cross-asset analysis suggests that a sustained risk-off environment may bolster demand for traditional safe-haven assets, whereas equities in high beta regions such as Australia could face continued pressure. Nonetheless, market participants should closely monitor shifts in bond yields and currency dynamics that may provide additional context to equity movements.
Forward Outlook
While a break above 8875.73 could open the door to a bullish phase, the predominant outlook remains neutral to bearish with an anticipated trading range between 8788.97 and 8875.73. Continued bearish developments below 8788.97 may solidify the downside projection, contingent upon macroeconomic data confirmations, particularly the unemployment rate outcome and broader risk sentiment trends shaped by ongoing S&P 500 forecasts.
Prime Trader Global | AI Market Intelligence | All insights derived from factual market data.