2025-11-07 04:15 UTC
Lead Overview
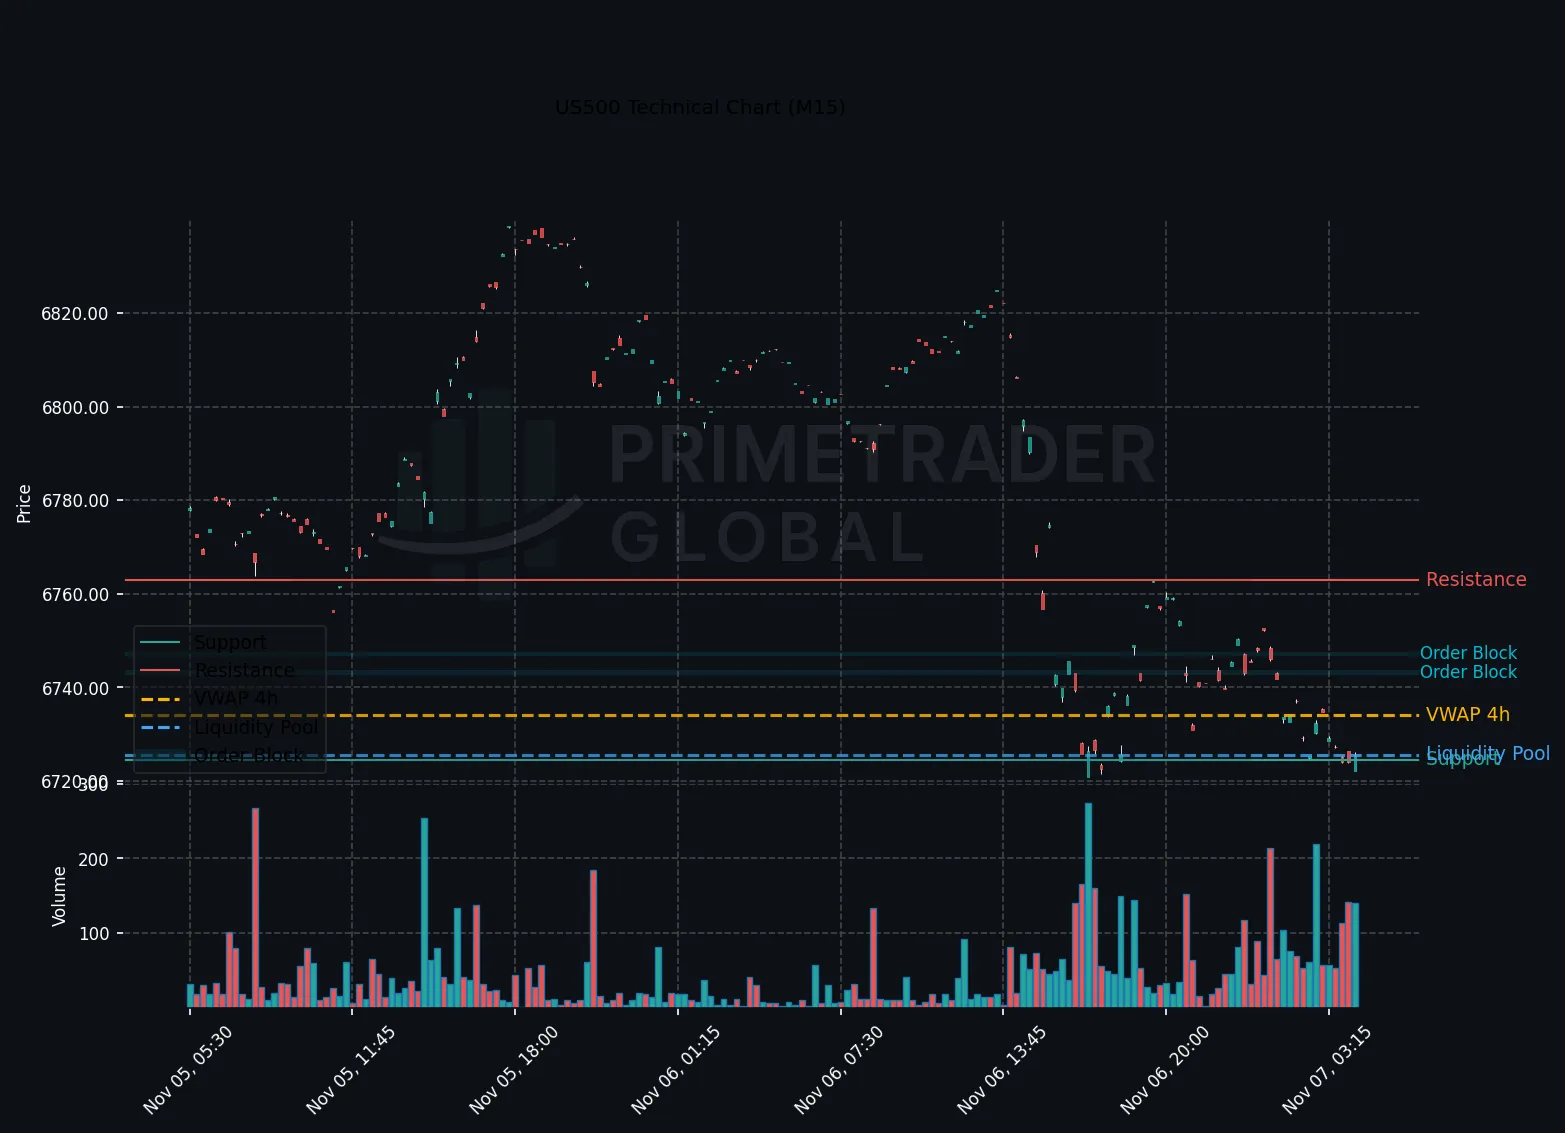
The US500 continues to exhibit a strong bearish trend into the Asia session. Despite a neutral macro bias, all timeframes align with a marked bearish sentiment. The forthcoming University of Michigan (UoM) inflation expectations are generating caution among traders. While household-spending themes suggest a potential for broader economic implications, immediate impacts on the US500 are expected to remain limited unless the data prompt a significant shift in market expectations for interest rates.
Macro Drivers
Current market dynamics position the US500 within a persistent bearish framework driven by global macroeconomic factors, including rate anticipation and inflation dynamics. The upcoming UoM inflation expectations could serve as a pivotal point; however, without marked deviations from forecasted figures, the macro environment may continue to exert bearish pressure on the index.
Key Technical Anchors
The technical landscape marks a key support level at 6720.8, with resistance observed at 6819.6. The prevailing trend indicates potential for continued downside should the US500 breach the lower threshold, with broader momentum reinforcing this scenario.
Cross-Asset Signals
Cross-asset analysis reveals synchronized pressure across equities and bonds, indicating a consolidated risk-off sentiment. This alignment across asset classes further entrenches the bearish outlook for the US500, deterring interventional shifts from isolated positive drivers.
Forward Outlook
The forward outlook for the US500 remains bearish, with a 59% probability of further declines should support at 6720.8 be breached. Any unexpected upside break above 6819.6 remains a low-probability scenario at 7%. The anticipation of UoM data poses a potential inflection point but is unlikely to catalyze a significant trend reversal given the current macroeconomic landscape.
Prime Trader Global | AI Market Intelligence | All insights derived from factual market data.