2025-11-04 11:58 UTC
Lead Overview
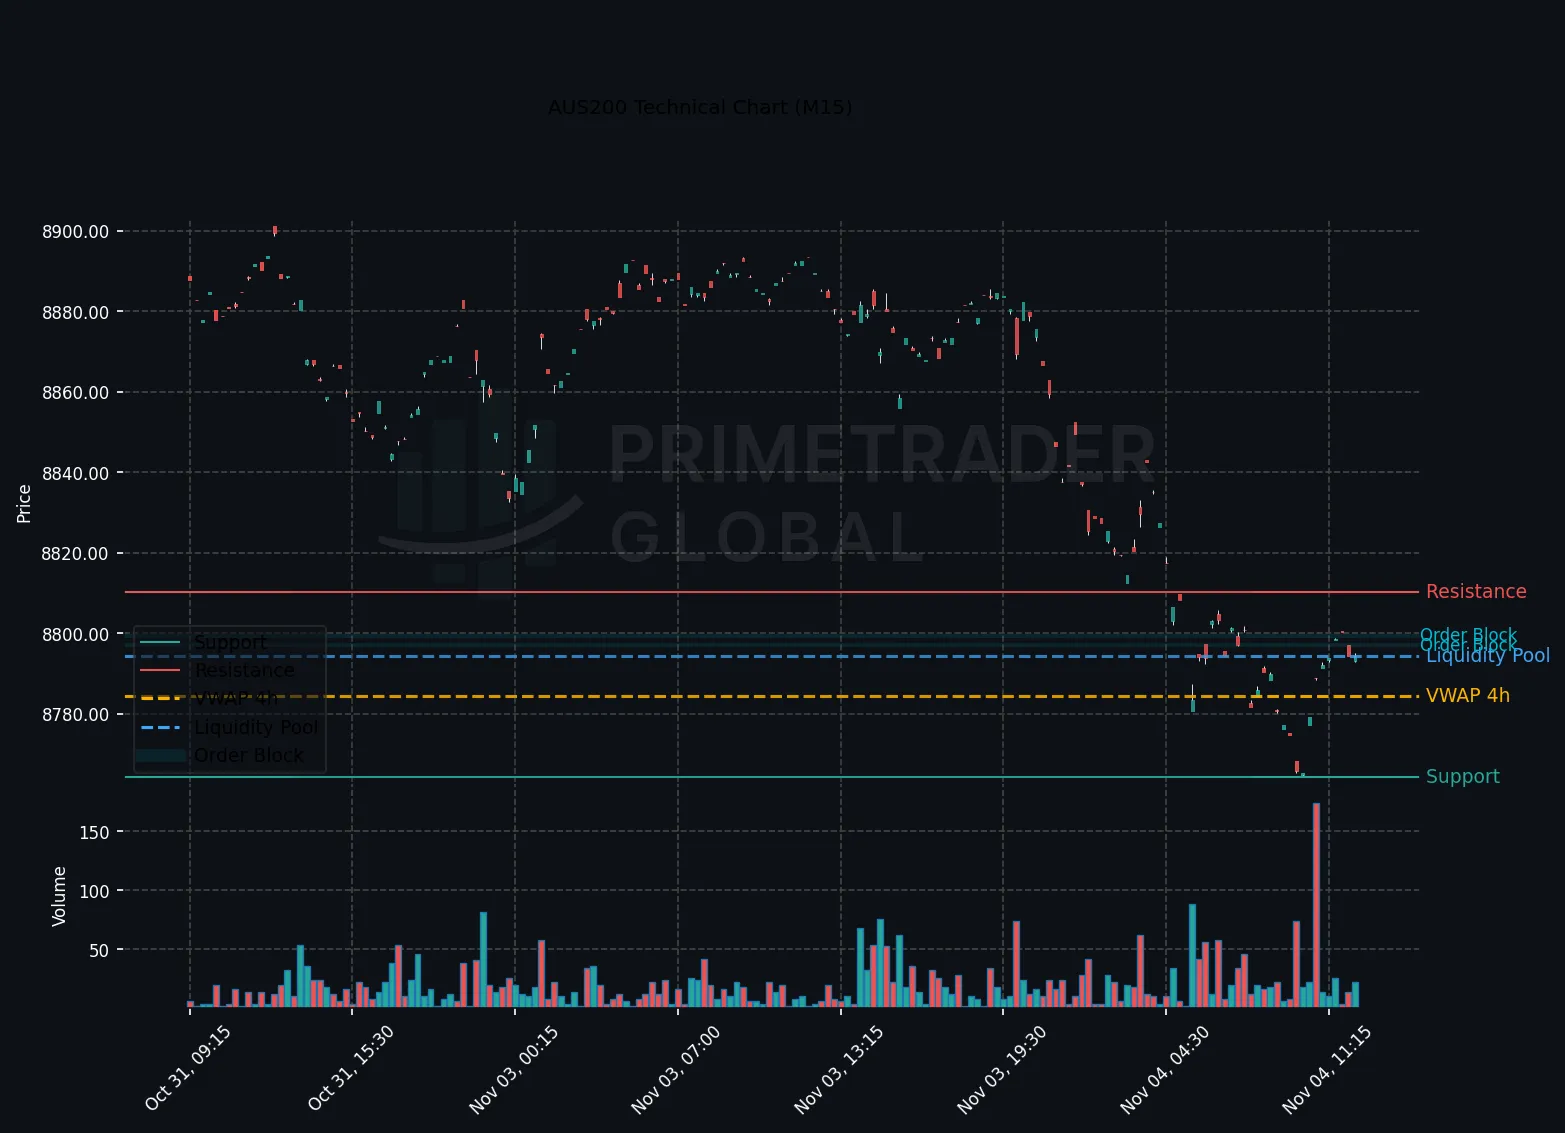
During the European session, the AUS200 index has maintained a strong bearish momentum on the H1 chart. Despite the Reserve Bank of Australia’s press conference aiming to stabilize macro sentiment, the index remains pressured. Amplifying this bearish trend are sizable short positions taken by Michael Burry against key tech stocks like Nvidia and Palantir, further enforcing a risk-off tone. Current market dynamics reveal a 50% probability for continued downside, contrasting with a mere 9% for bullish reversals.
Macro Drivers
The RBA’s recent communications have emphasized the perseverance of high interest rates, contributing to deflationary pressures on asset valuations. Additionally, Michael Burry’s strategic shorts have introduced an element of caution among institutional investors, spurring defensive shifts across equities particularly affected by speculative positioning.
Key Technical Anchors
The AUS200’s key technical levels are defined by significant price boundaries, with support at 8780.86 and resistance at 8893.47. Breaching these thresholds will likely dictate near-term directional bias, confirming either the strength of the bearish momentum or catalyzing a potential reversal.
Cross-Asset Signals
In cross-asset terms, the upward pressure on global bond yields following the RBA commentary has compounded the vulnerability of equity indices, especially those with a high-tech weighting. This dynamic is mirrored in increasing volatility indexes, signifying heightened risk aversion among market participants.
Forward Outlook
Given the bearish sentiment reinforced by macro and technical indicators, the AUS200 is vulnerable to further declines should it breach the 8780.86 support level. Conversely, surpassing 8893.47 could introduce scenarios of upside recovery amid cautious macro conditions. Observers should remain attentive to any pivot in the broader global yield environment and the implications of speculative tech repositioning on equity landscapes.
Prime Trader Global | AI Market Intelligence | All insights derived from factual market data.