2025-10-31 10:19 UTC
Lead Overview
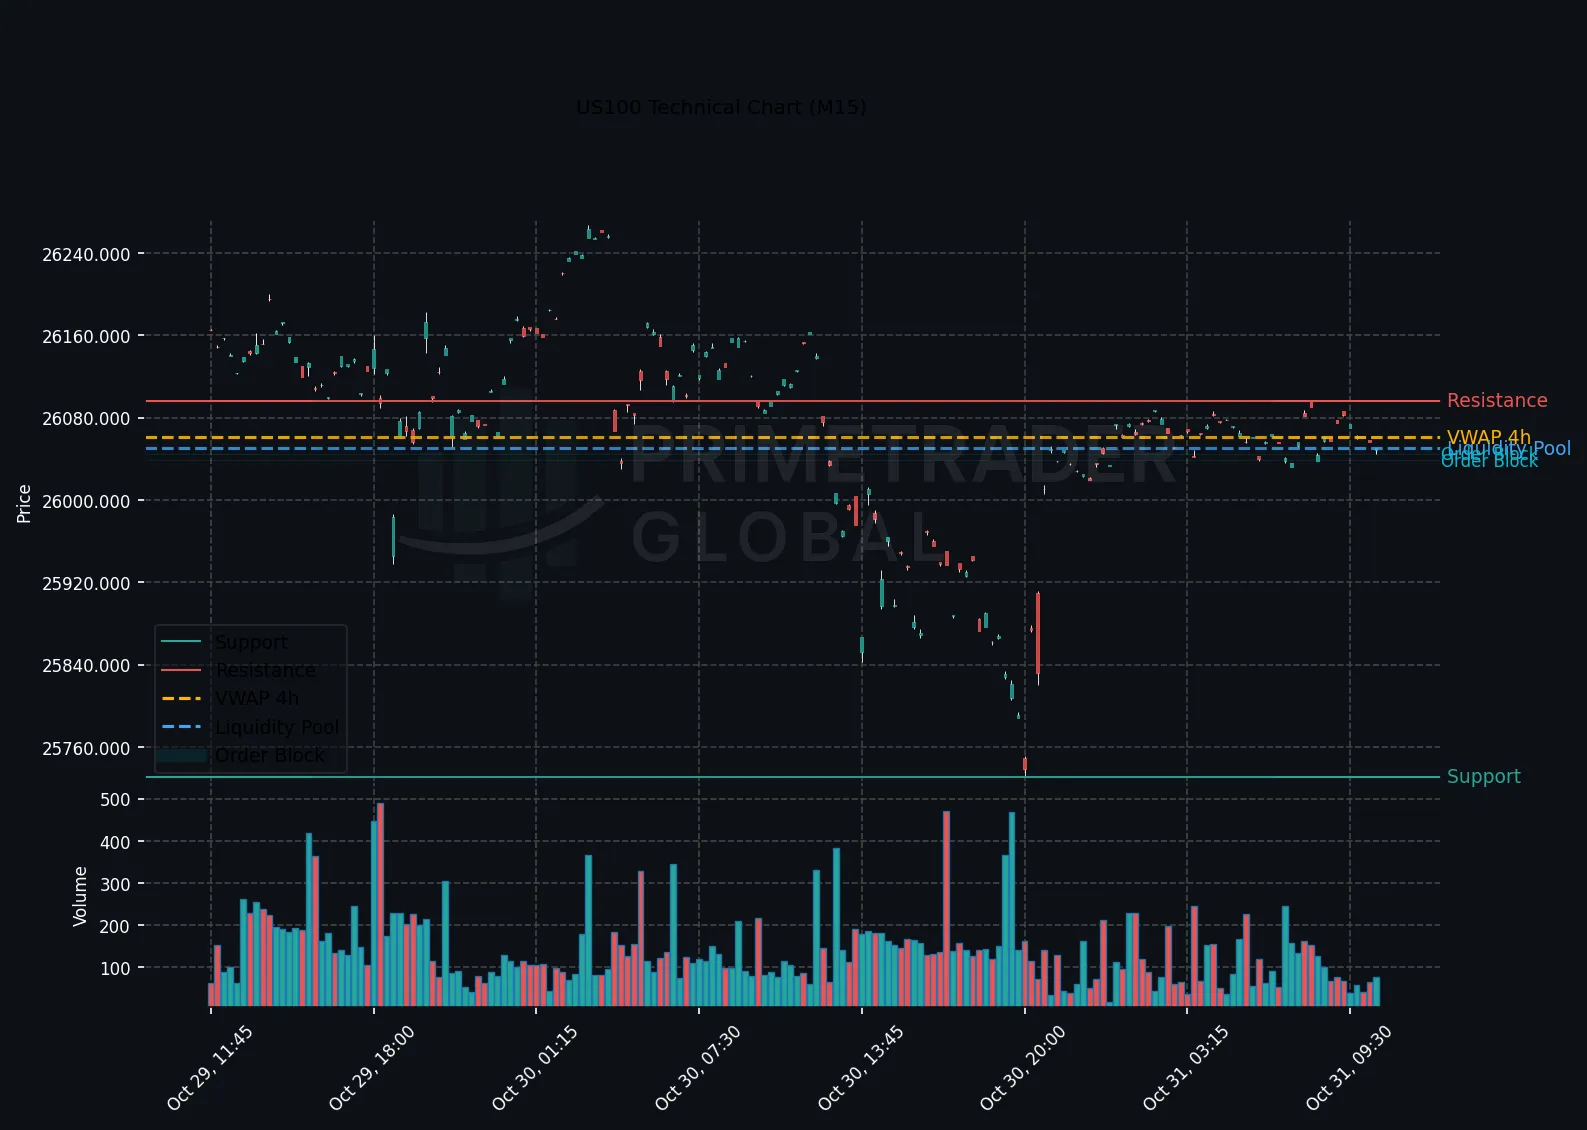
The US100 index exhibits a predominantly bearish outlook as European markets engage, with an 82% probability of downside extension should the index drop below the critical level of 25731.31. Despite mixed signals across timeframes suggesting potential range-bound behavior, bearish pressure remains pronounced. Sector-specific movements, particularly within major energy companies like Exxon and Chevron, could influence broader market dynamics during the session.
Macro Drivers
No significant macroeconomic events are slated for today, leaving market participants to focus on sectoral shifts and corporate news for trading cues. The performance of key cap-weight constituents, such as Exxon and Chevron, may provide impetus for moves within the index, either intensifying current trends or catalyzing temporary reversals.
Key Technical Anchors
Key support and resistance levels for the US100 are set at 25731.31 and 26258.06, respectively. These anchors provide operational thresholds for market participants closely monitoring potential breakout or breakdown scenarios. The prevailing bearish bias favors attentiveness around the 25731.31 level for any signals of sustained downside activity.
Cross-Asset Signals
The broader equity landscape and sector performance, primarily within the energy sector, hold the capacity to shape cross-asset sentiment. Movements in these areas may influence US100’s trajectory by affecting risk appetite and allocation strategies. Traders should watch for correlations with energy commodity prices and subsequent implications on US100’s performance.
Forward Outlook
Looking ahead, market focus remains on the lower threshold of 25731.31, which, if breached, could precipitate further losses in alignment with the current bearish trend outlook. However, if positive developments arise from key energy stock performances, there could be limited upward adjustments within the 25731.31–26258.06 range, lending support to the case for a neutral positioning strategy as market participants reassess risk parameters.
Prime Trader Global | AI Market Intelligence | All insights derived from factual market data.