2025-10-09 16:43 UTC
Lead Overview
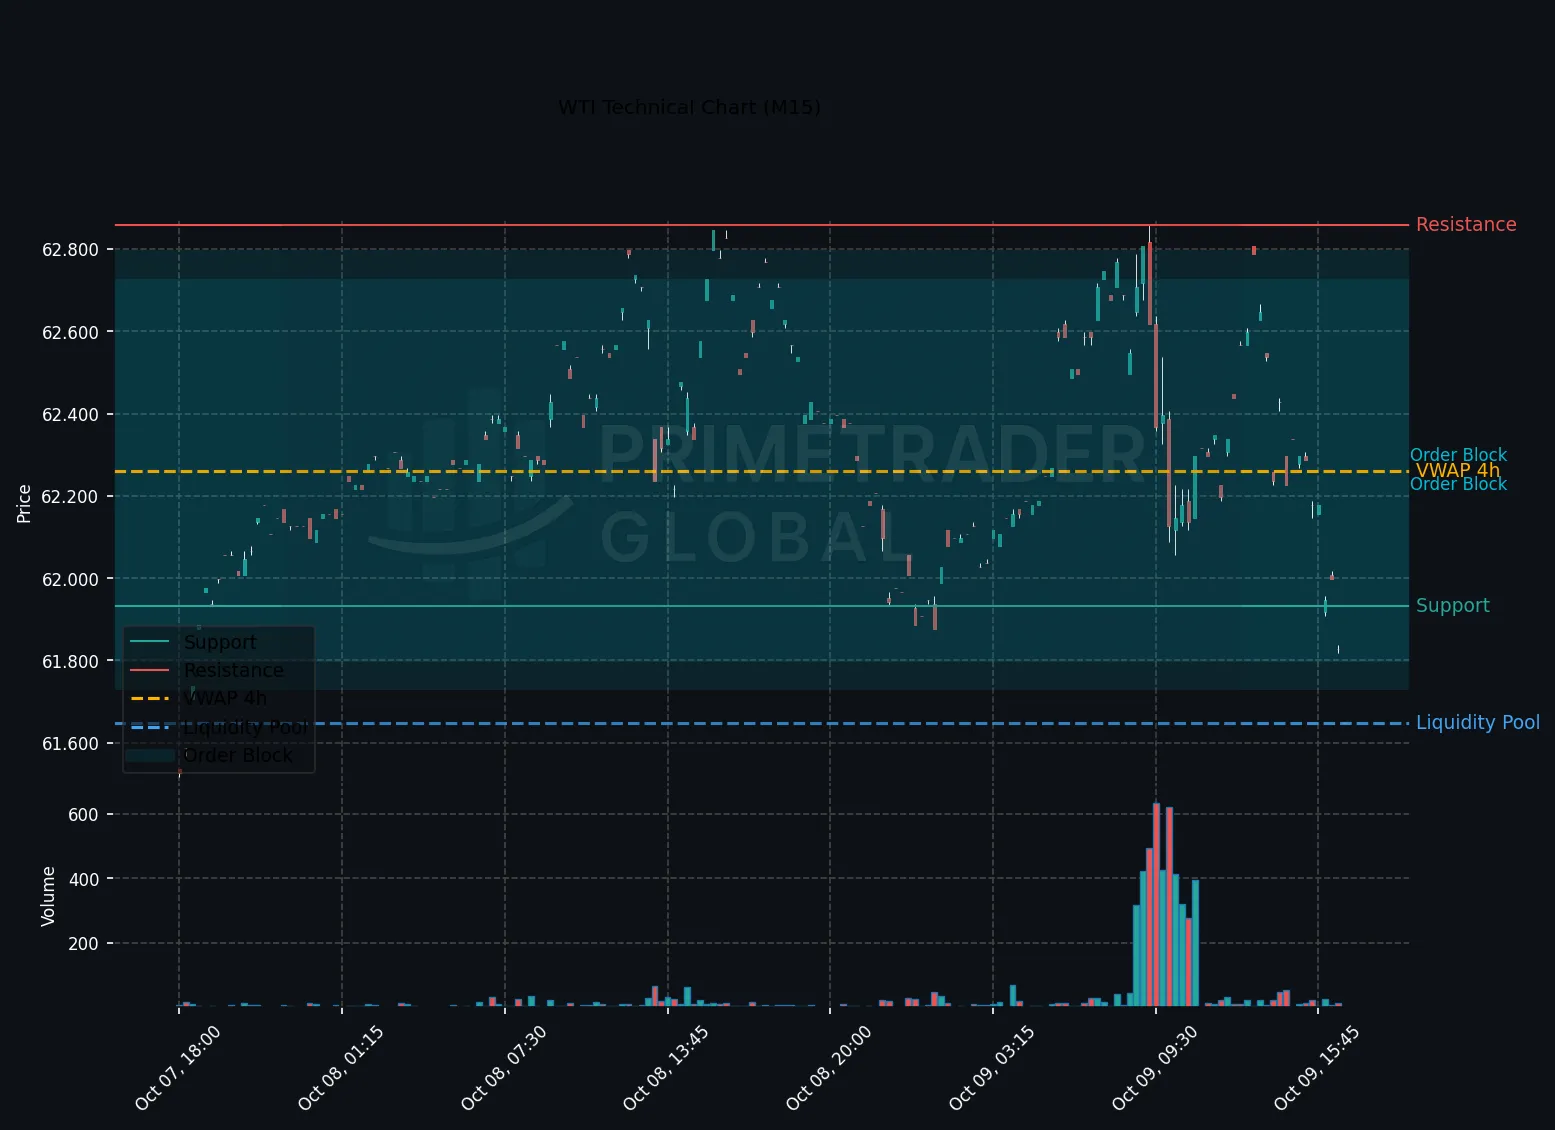
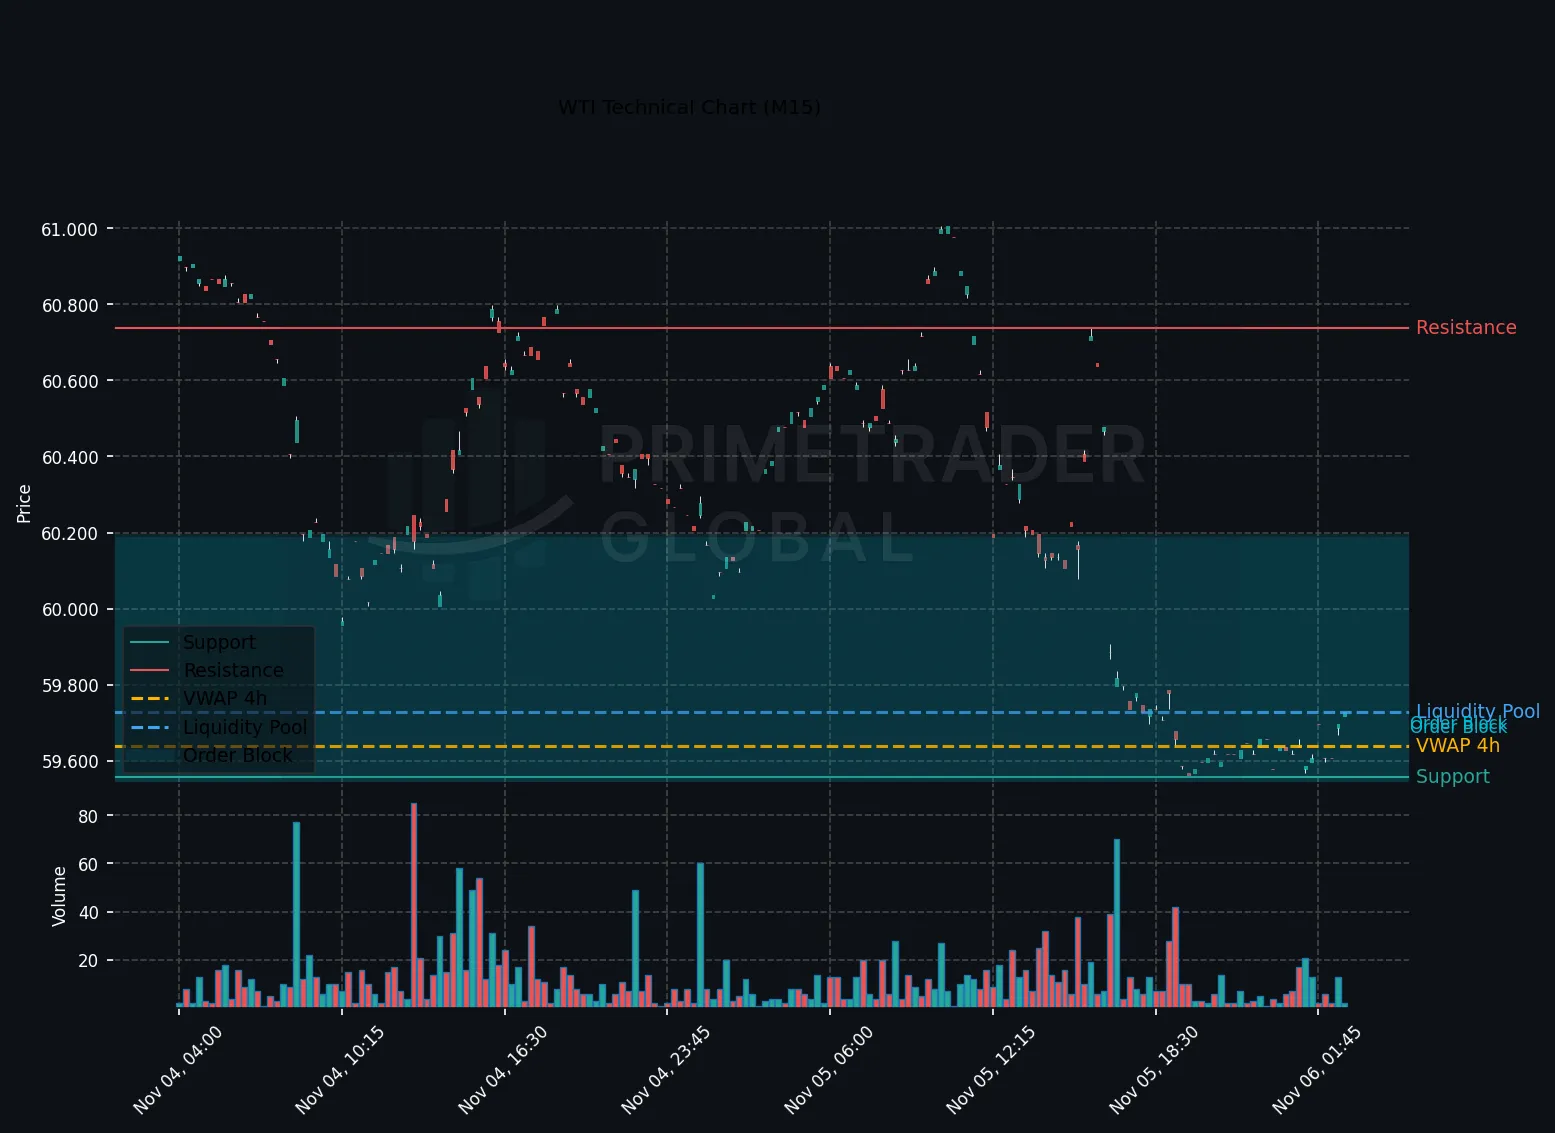
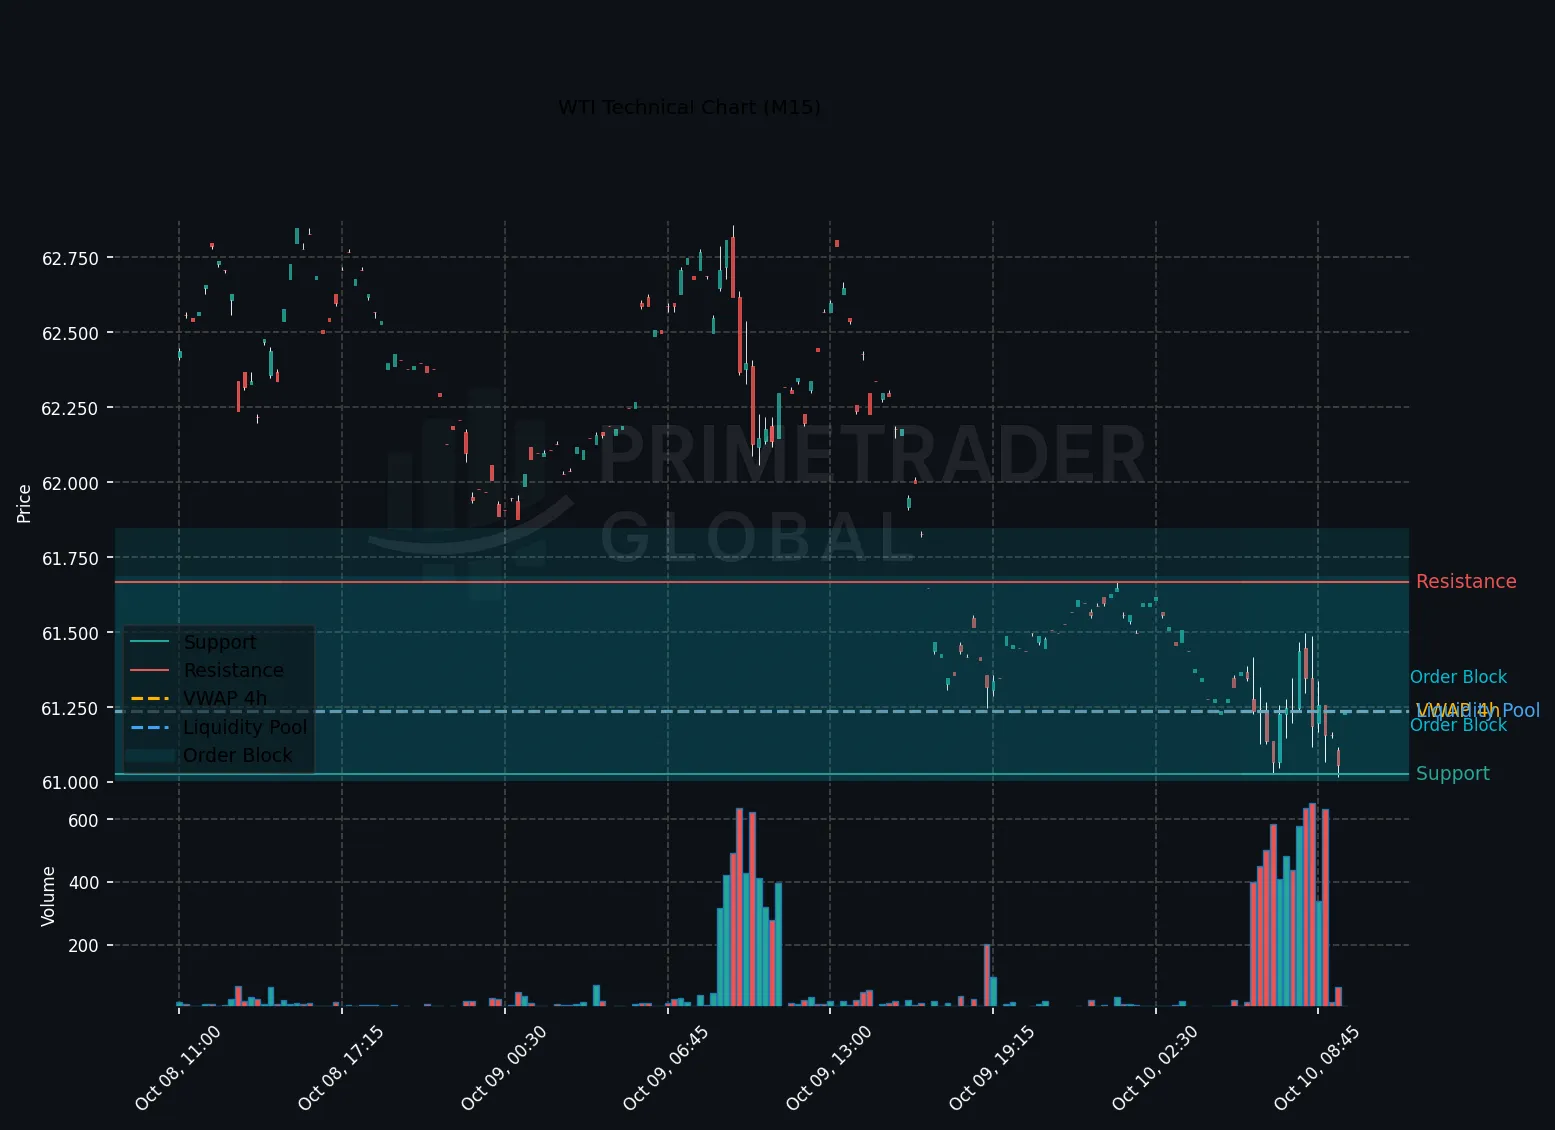
During the US trading session, WTI crude oil exhibited signs of a risk-on momentum within the H1 timeframe. The short-term outlook remains slightly bullish, underpinned by price stability, even as broader timeframe assessments suggest the potential for range-bound dynamics. Institutional focus should center on H1 chart support and resistance levels as market participants gauge potential price direction amidst mixed signals.
Macro Drivers
The macro backdrop remains relatively quiet with no significant events directly impacting WTI. However, the developing risk-on sentiment is reflective of broader market risk appetite, possibly tied to global economic data points or central bank actions that have yet to surface prominently.
Key Technical Anchors
On the technical front, the primary levels to monitor on the H1 chart are the support at 61.457 and resistance at 62.847. The current bullish tendency suggests that a break above resistance may pave the way for further gains. Conversely, failure to clear these levels could reinforce a trading range scenario.
Cross-Asset Signals
WTI’s price action should be interpreted alongside other commodities and risk assets for a holistic view. Any correlation shifts, particularly with equities or the dollar, might refine the implicit bullish bias. The absence of significant catalysts currently emphasizes the technical positioning over cross-asset influences.
Forward Outlook
The outlook for WTI crude oil shows a 55% probability of a bullish continuation if prices break above the 62.847 level. The alternative scenarios include a 31% likelihood of range-bound trading between the defined support and resistance levels, and a 15% risk of downside extension should price breach the 61.457 support. Traders should maintain strategic vigilance, aligning positions accordingly as cues emerge.
Prime Trader Global | AI Market Intelligence | All insights derived from factual market data.