2025-10-16 18:51 UTC
Lead Overview
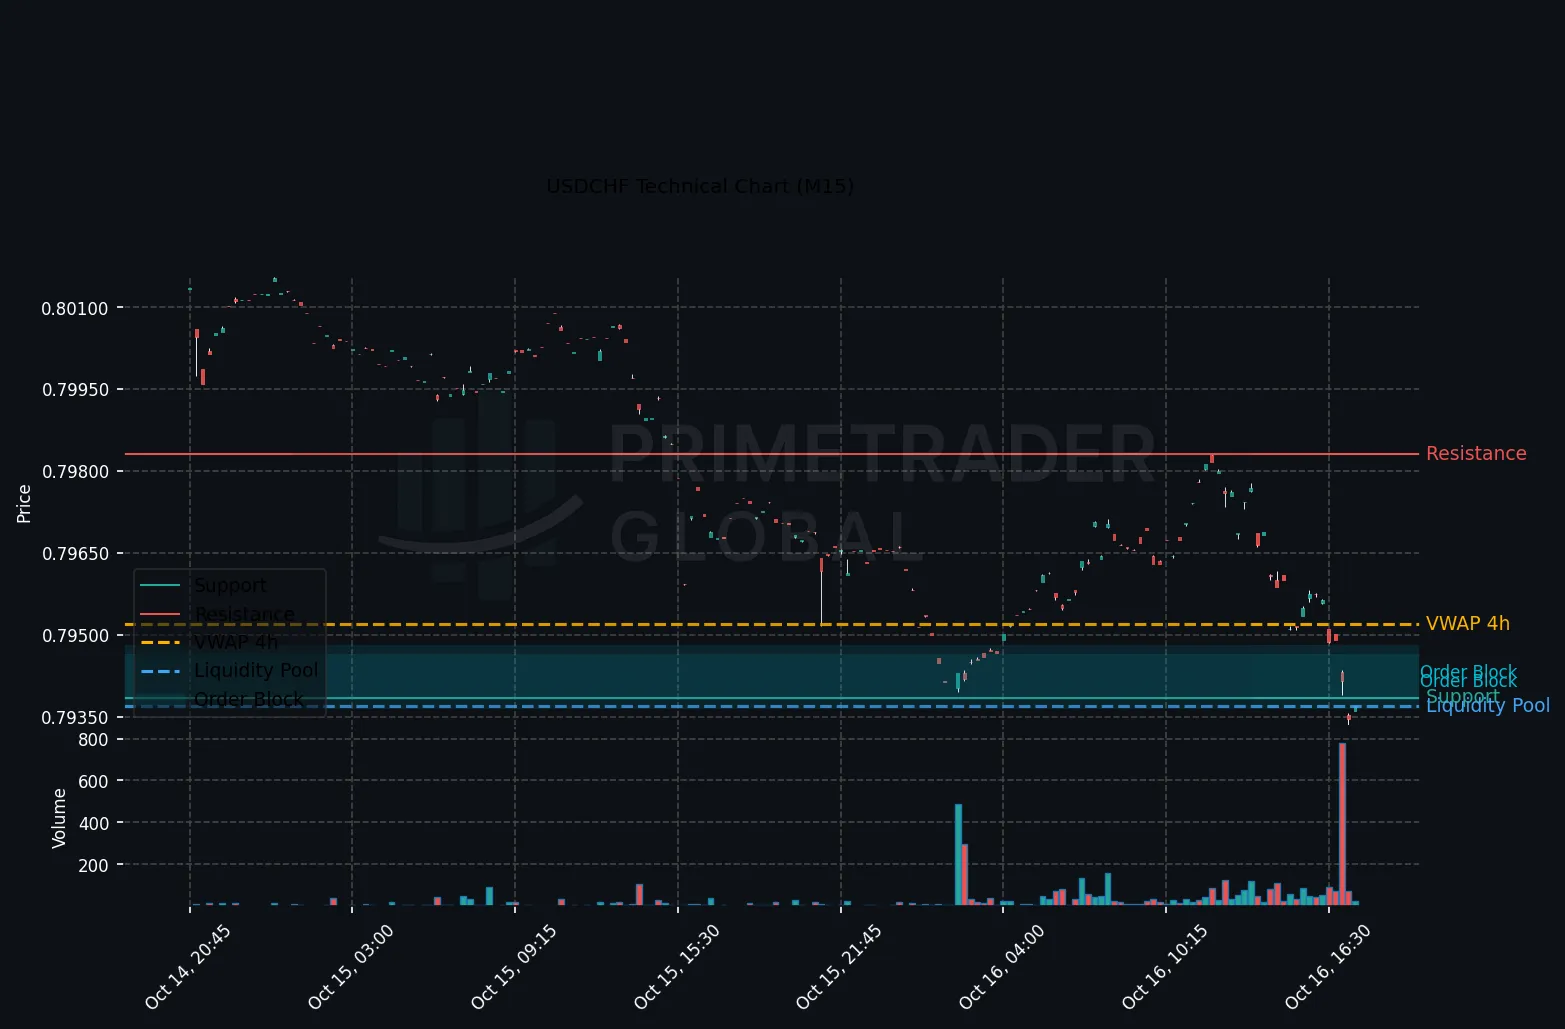
The USDCHF pair remains firmly entrenched in a bearish trend, as observed on the H1 chart, reflecting a broader alignment across all timeframes. This sustained downtrend is further exacerbated by a notable 1% decline in the S&P 500, triggering CHF safe-haven inflows and deepening USDCHF losses. With no significant economic data releases on the horizon, market participants are keenly observing key technical levels to gauge potential future movements.
Macro Drivers
The primary macro factor influencing the USDCHF pair is the pronounced risk-off sentiment evidenced by the recent sell-off in US equities. This market environment enhances the appeal of traditional safe-haven assets like the Swiss Franc, adding downside pressure on the USDCHF exchange rate. Despite an Emerging Risk-On macro bias, the immediate market dynamics favor CHF strength due to heightened market volatility and equity weakness.
Key Technical Anchors
Crucial support and resistance levels for USDCHF on the H1 chart stand at 0.79385 and 0.80067, respectively. A break below the support might extend current bearish trends, while a rise above resistance could suggest a potential bullish reversal. However, given the alignment of all timeframes towards a strong bearish bias, immediate prospects lean towards further declines unless sentiment shifts significantly.
Cross-Asset Signals
Current cross-asset analysis pinpoints a correlation between the performance of the US equity market and USDCHF dynamics. The downturn in the S&P 500 fuels risk-averse behavior, prompting flows into the Swiss Franc. Additionally, any sign of stability or reversal in equities could temporarily alleviate pressure on USDCHF, highlighting the importance of monitoring broad market signals for informed positioning.
Forward Outlook
Looking forward, the bearish momentum in USDCHF remains underpinned by unfavorable macro conditions and technical indicators. However, scenarios vary: a break below 0.79385 could signal further losses, while maintaining a range between 0.79385 and 0.80067 suggests market indecision. Conversely, should bullish conditions materialize, breaking above 0.80067 may initiate a recovery phase. As ever, the evolving interplay between market sentiment and technical signals will dictate actionable trading strategies.
Prime Trader Global | AI Market Intelligence | All insights derived from factual market data.