2025-10-16 13:07 UTC
Lead Overview
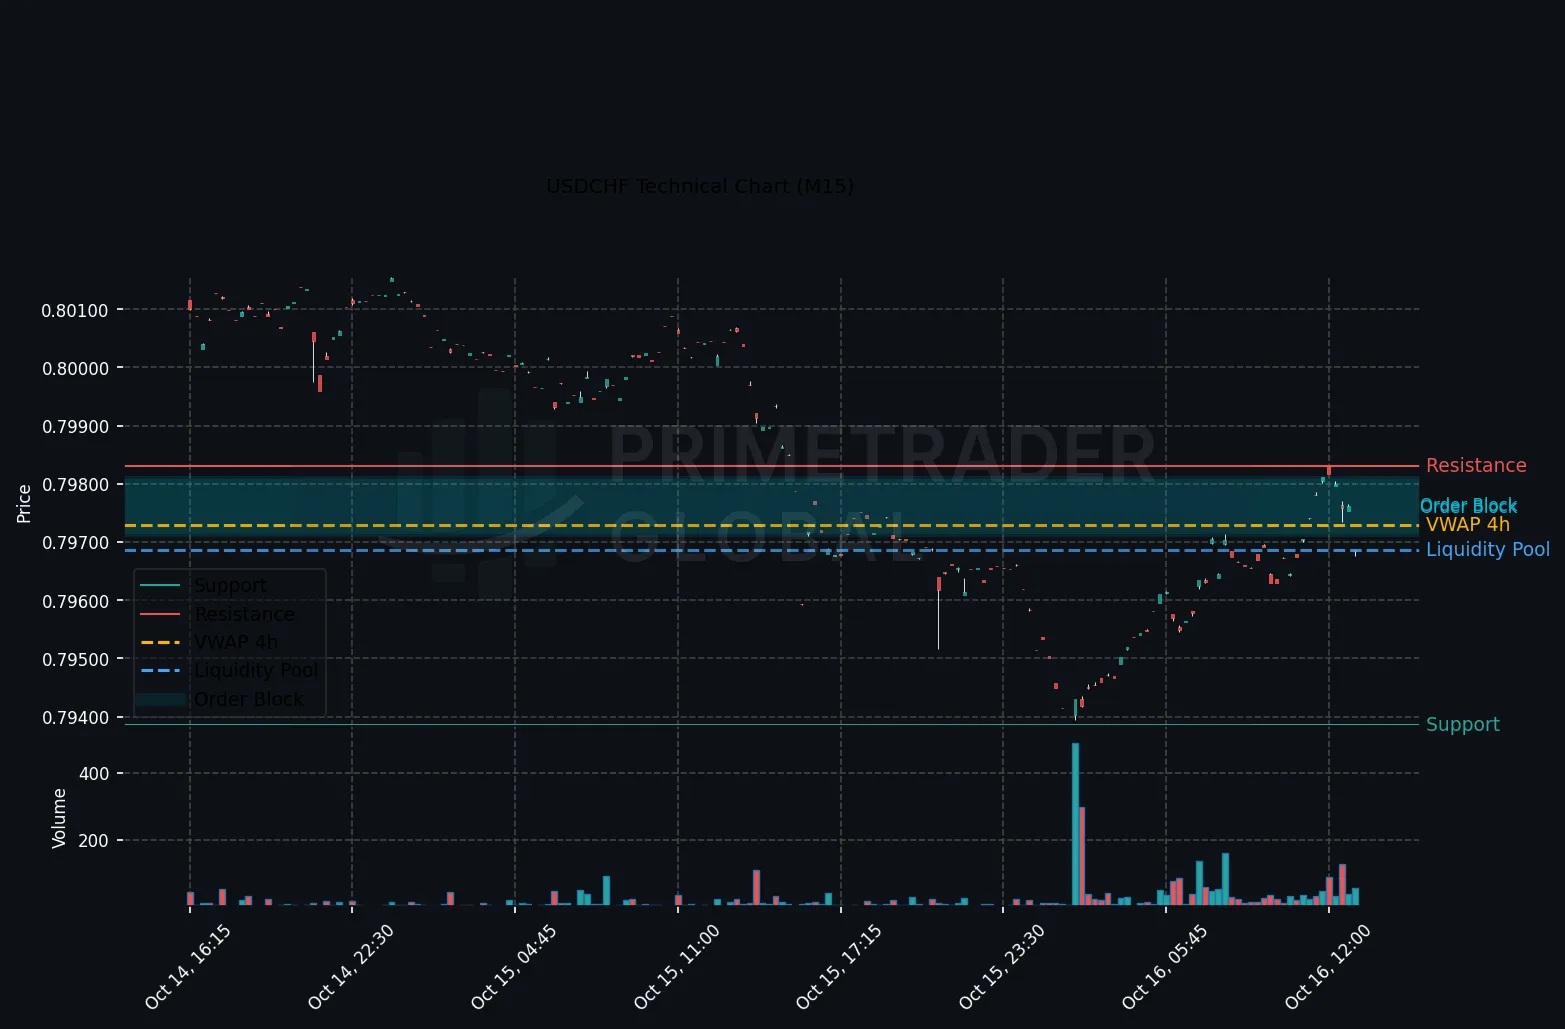
In the European session, USDCHF’s H1 trend shifted to a bearish stance amid a risk-off environment spurred by the unexpected weakness in the October Philly Fed index (-12.8 vs +8.5 forecasted). This development pressured the dollar while increasing demand for CHF. Multi-timeframe correlations are mixed, indicating a possible range-bound movement unless H1 momentum strengthens significantly. Current forward probabilities suggest a neutral bias (50%) with lower possibilities for bearish (34%) and bullish (17%) developments.
Macro Drivers
The significant deviation in the Philly Fed index sharply impacted market sentiment, marking a move away from riskier assets, thus benefiting safe-haven currencies like the CHF. The combination of disappointing U.S. economic data and broader risk-off themes is exerting pressure on USDCHF, aiding CHF gains.
Key Technical Anchors
Technical analysis reveals critical levels with support at 0.79385 and resistance positioned at 0.80067. These anchor points are crucial, as a breach of either could signal the next directional move, with a break below support potentially extending losses.
Cross-Asset Signals
Cross-asset correlations are displaying heightened defensive posturing, as evidenced by moves in treasury yields and equity indices, further underlining the risk-off sentiment. FX markets are echoing this theme with CHF and other haven currencies gaining traction.
Forward Outlook
Looking ahead, we anticipate a potential range-bound scenario for USDCHF, likely constricted within 0.79385–0.80067, aligned with the current neutral evaluation. The overarching influence of macroeconomic releases, including U.S. data points, will be instrumental in shaping near-term market movements. Surveillance of risk sentiment shifts remains essential for a strategic position.
Prime Trader Global | AI Market Intelligence | All insights derived from factual market data.