2025-10-15 03:18 UTC
Lead Overview
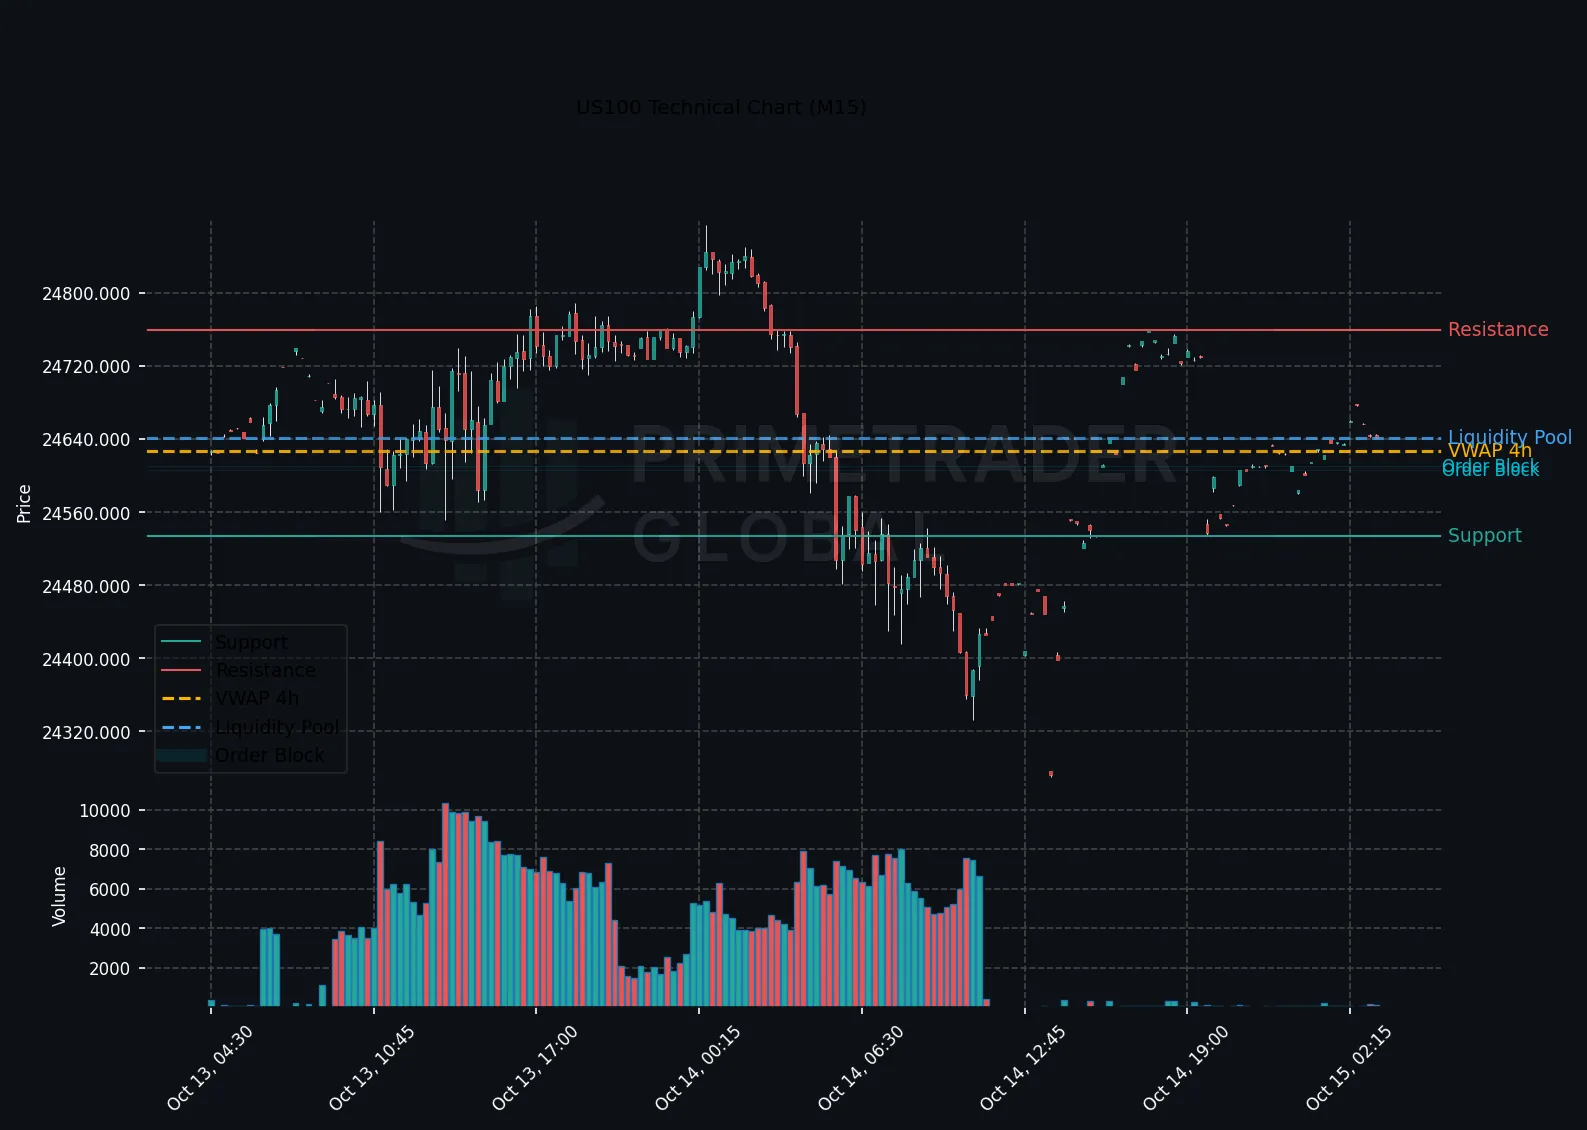
The US100 index on the H1 chart continues to exhibit a neutral, range-bound profile in the Asian session. This stability prevails against a backdrop of mixed signals across different timeframes and recent Federal Reserve Chair Powell’s commentary. As global investors position themselves, the forthcoming Empire State Manufacturing release is poised to offer more direction.
Macro Drivers
Investor sentiment is currently dictated by a confluence of macroeconomic elements, notably the implications of Powell’s recent remarks and inflationary pressures highlighted by rising consumer costs, exemplified by the sharp increase in FIFA World Cup ticket prices. These dynamics could sway consumption patterns and impact the performance of the tech-heavy US100 index. The Empire State Manufacturing Index will soon provide fresh insight into the health of the U.S. manufacturing sector, potentially influencing near-term index behavior.
Key Technical Anchors
The US100 index on the H1 timeframe is constrained within a defined range, with 24332.16 as key support and 24873.54 marking critical resistance. This establishes a pivotal framework for assessing potential breakout movements or confirmation of continued range-bound behavior.
Cross-Asset Signals
Across the broader market, current cross-asset analysis suggests limited directional conviction, with other sectors witnessing similar range-bound trading as investors await macroeconomic data. Currency pairs and bond yields remain steady, with little deviation anticipated until further economic indicators are released.
Forward Outlook
The prospect of the US100 breaking above 24873.54 could trigger upward momentum continuation, albeit recent data suggests a 27% probability for this scenario. A neutral stance remains, with a range likely persisting between 24332.16 and 24873.54. Conversely, a drop below 24332.16 could substantially extend losses, supported by a 63% probability outlook.
Prime Trader Global | AI Market Intelligence | All insights derived from factual market data.