2025-10-13 13:15 UTC
Lead Overview
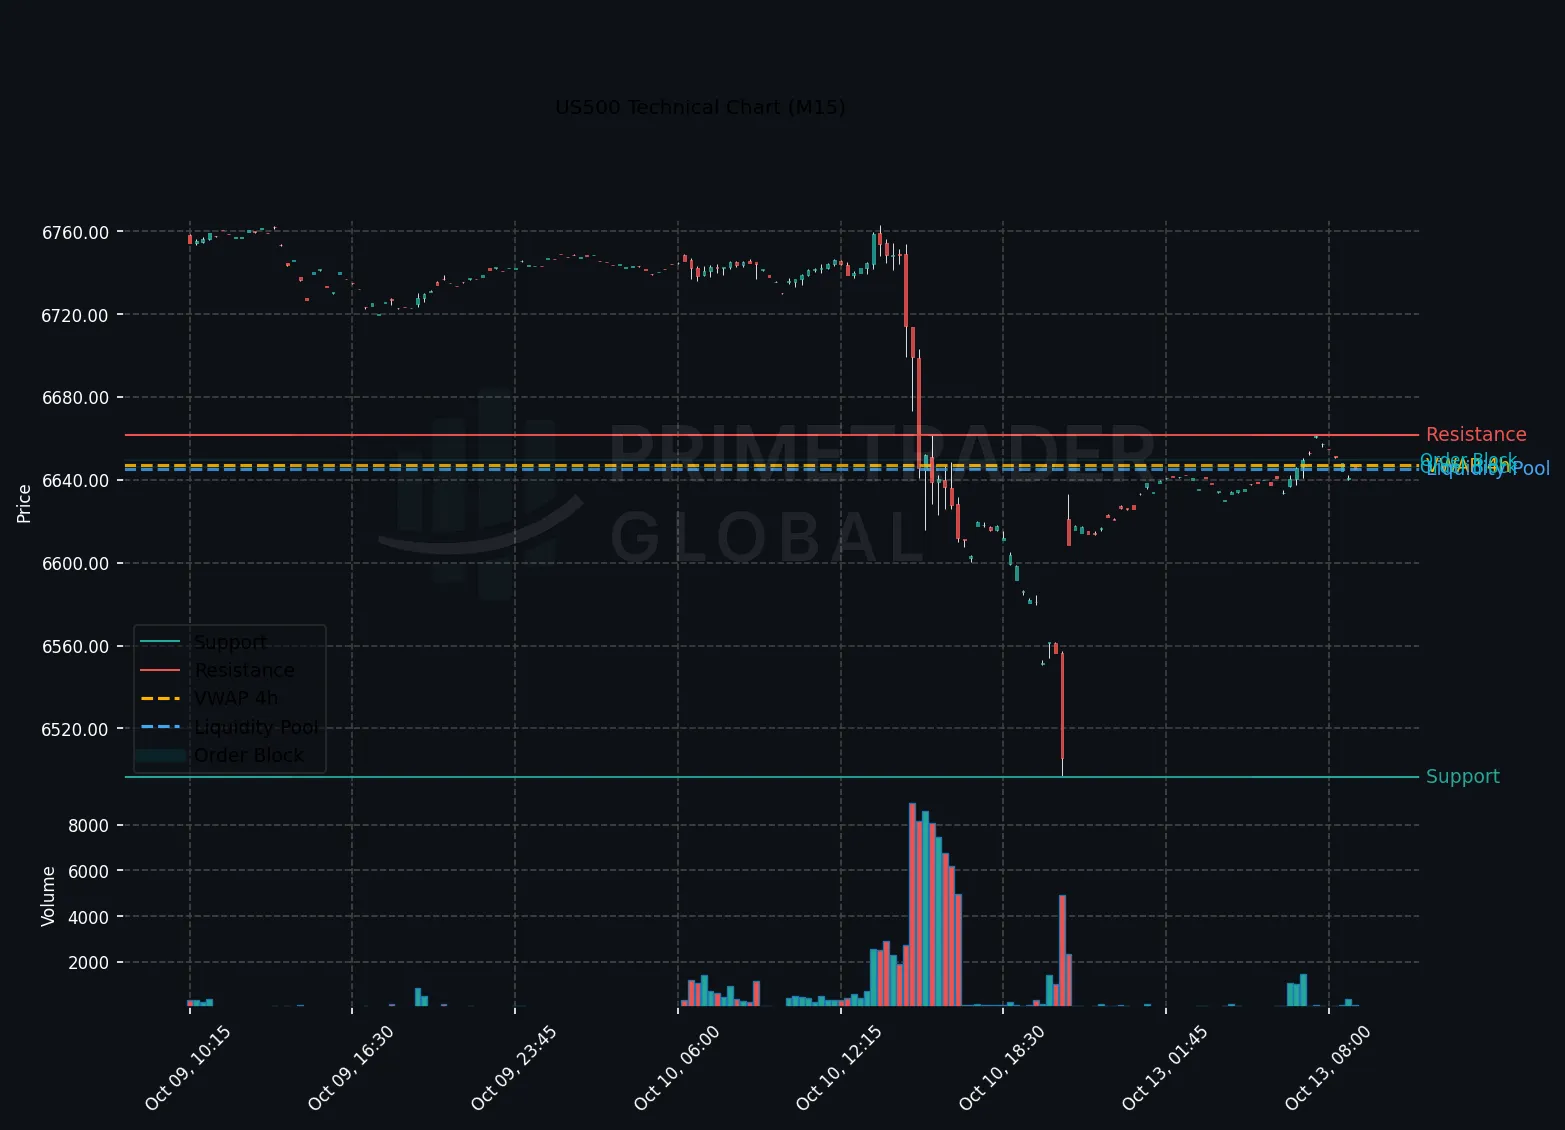
The US500 index is encountering significant bearish momentum during the European trading session, predominantly influenced by technical indicators on the H1 chart. Despite a lingering neutral macro bias, the resurgence of US banking sector M&A activity, led by JPMorgan, could intermittently uplift market sentiment. However, this trend appears insufficient to counteract prevailing downside technical pressure, positioning the index firmly within a delineated range.
Macro Drivers
The broader macroeconomic environment remains largely unchanged, maintaining a neutral backdrop. However, recent M&A activity involving prestigious financial institutions like JPMorgan introduces episodic shifts in market perceptions and underscores potential tailwinds in banking sector earnings. These factors may modestly offset bearish tendencies but are unlikely to decisively break the current engagement in the intermediate term.
Key Technical Anchors
On the technical front, the H1 chart reflects robust bearish currents with support established at 6550.68 and resistance marked at 6762.76. A breach of either boundary could determine the next directional move, with a potential bearish expansion if the lower support fails to hold.
Cross-Asset Signals
The intersection of sector-specific enthusiasm, particularly around M&A-centric banking plays, offers a compelling narrative in cross-asset evaluations. While this activity promises elevated volatility and tactical adjustments in short-term equities sentiment, the enduring factors remain heavily contingent on broader economic dynamics and central banking policy shifts.
Forward Outlook
The prevailing probability outlook indicates a 43% likelihood of extended losses if the index drops below the 6550.68 support level, pointing to sustained bearish conditions. Meanwhile, the potential for short-term market buoyancy—attributed to M&A developments—holds a moderate 12% probability of bullish advancement with a breakthrough above 6762.76.
Prime Trader Global | AI Market Intelligence | All insights derived from factual market data.