2025-10-08 10:19 UTC
Lead Overview
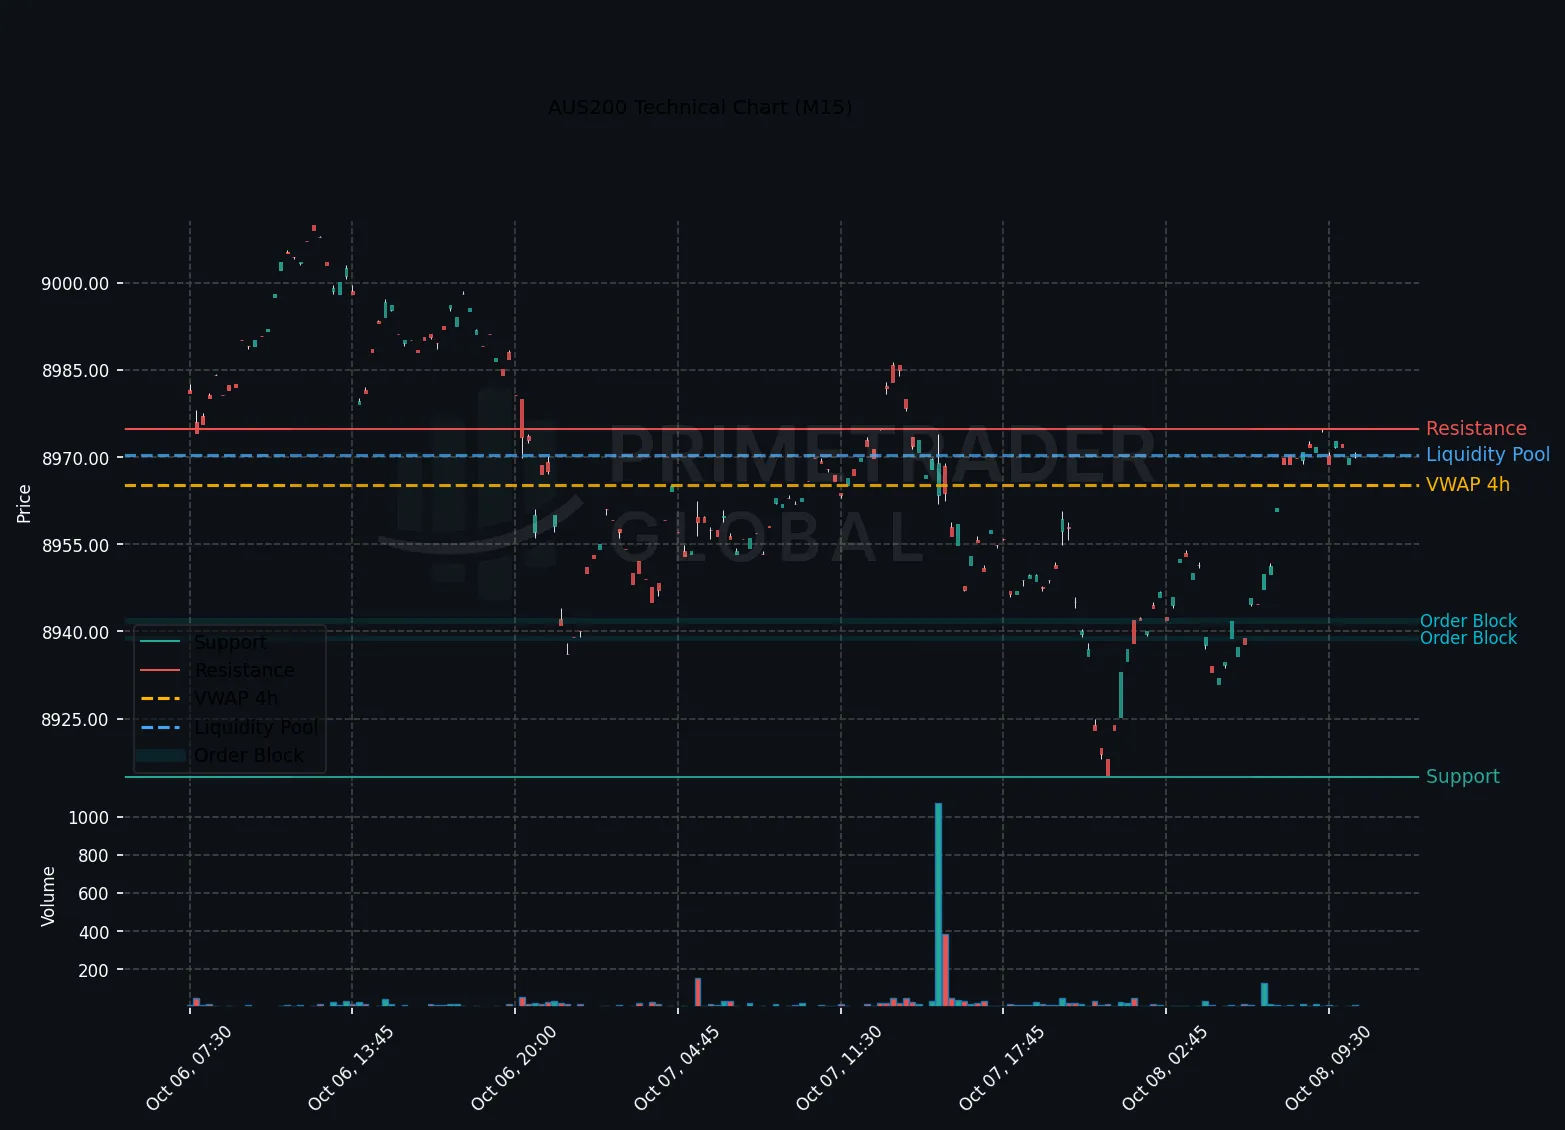
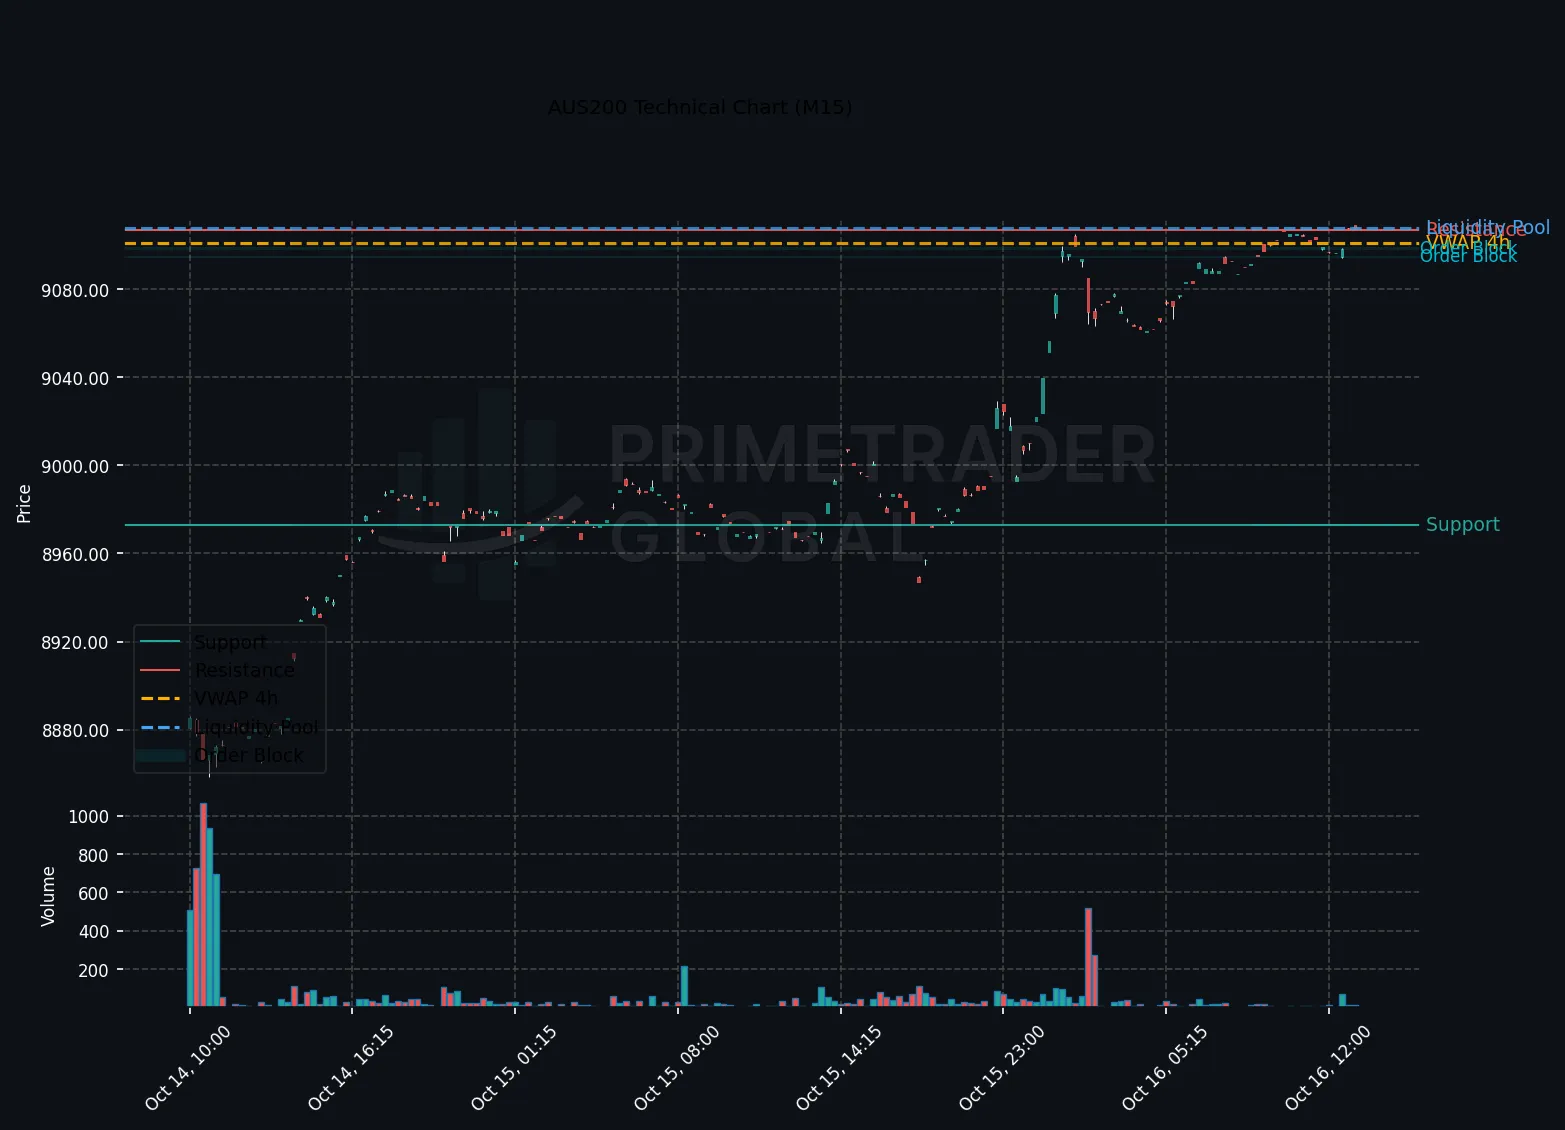
Amid the European session, the AUS200 index continues to display range-bound behavior, constrained by technical resistance at 8998.59 and support at 8922.99. With an overarching bearish sentiment prevailing, potential catalysts from mixed macroeconomic indicators suggest further downside risk. Institutional traders are closely monitoring these key levels for potential breakout or breakdown scenarios.
Macro Drivers
The present market conditions are shaped by macro factors that reflect a cautious risk appetite. BMW’s recent profit warning has amplified concerns over the German-Chinese economic relationship, impacting global risk dynamics. In turn, this has led to greater defensive positioning, especially in equity indices like the AUS200 which are sensitive to global risk sentiment shifts.
Key Technical Anchors
On the technical front, the AUS200 H1 chart exhibits crucial levels: support is anchored at 8922.99, with resistance capped at 8998.59. These levels are pivotal for institutional players crafting their intraday strategies. A decisive move beyond these thresholds could catalyze a significant directional trend, aligning with broader market sentiment.
Cross-Asset Signals
Cross-asset analysis underscores the potential for volatility, with equities exhibiting sensitivity to global macro signals. The current environment suggests that risk-on and risk-off sentiments are finely balanced, influencing the AUS200’s immediate trajectory. Traders are likely to monitor developments in other indices and bond markets for additional cues on positioning logic.
Forward Outlook
Looking ahead, the AUS200’s outlook remains predominantly bearish, with a drop below the 8922.99 level potentially leading to further losses. Conversely, a breach above 8998.59 could offer a short-term bullish scenario, though this remains the less probable outcome given existing market biases. Institutional strategists are advised to maintain vigilance on macro indicators and any shifts in cross-asset signals, which may adjust current tactical stances.
Prime Trader Global | AI Market Intelligence | All insights derived from factual market data.